Feature Comparison Chart Software

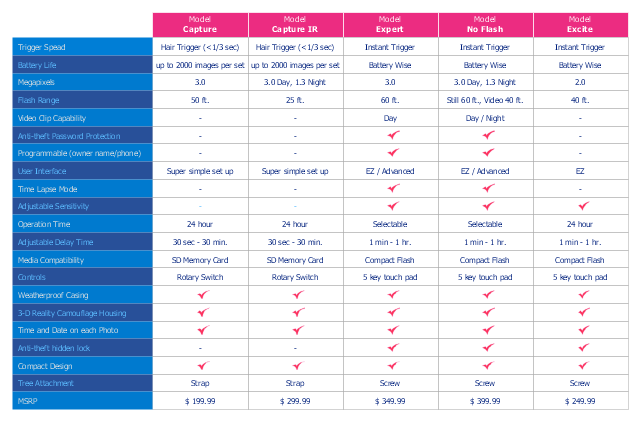
Competitive Feature Comparison Matrix is a tool to compare the features and functionality of competitive products or services in side-by-side table.
The feature comparison matrices are used for feature comparison analysis of competitive products and services.
This competitive feature comparison matrix chart example was created using the ConceptDraw PRO diagramming and vector drawing software extended with the Matrices solution from the Marketing area of ConceptDraw Solution Park.
Feature comparison chart
Financial Comparison Chart

Computer Hardware - Reseller Business Plan

Swot Analysis Examples for Mac OSX

Bar Chart Template for Word

SWOT Analysis matrix templates and samples
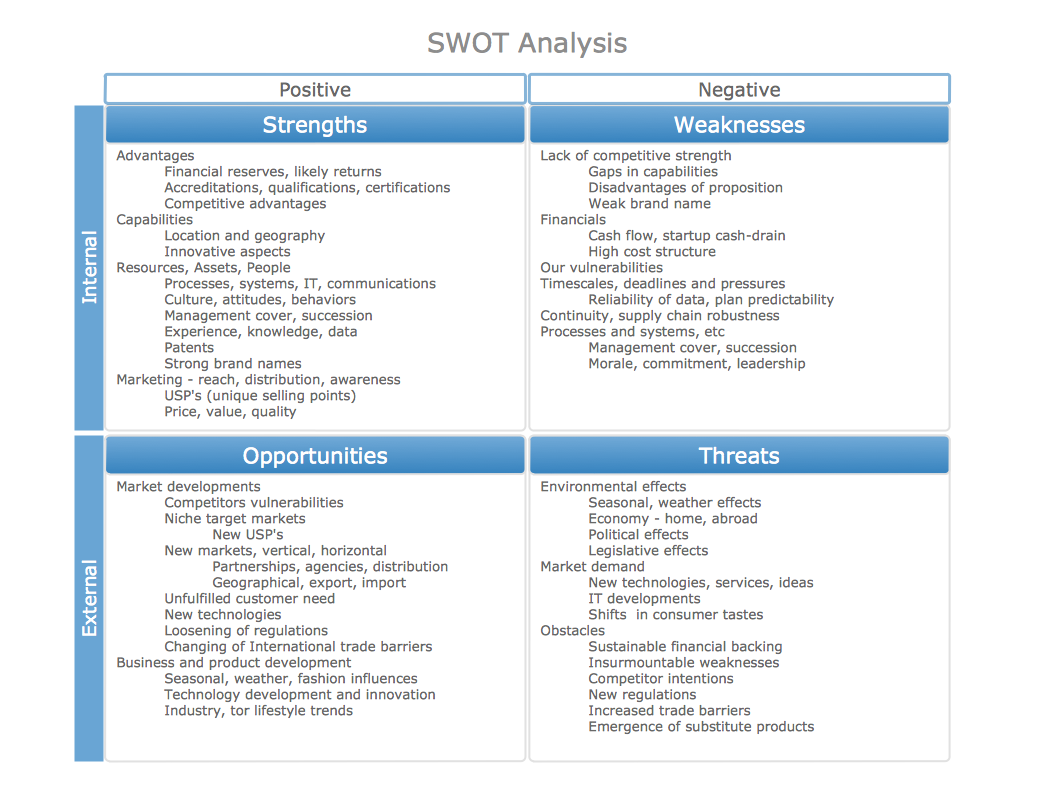
SWOT analysis Software & Template for Macintosh and Windows

Workflow Diagram Symbols

How to Create Presentation of Your Project Gantt Chart

- Marketing | Comparison Table Template Excel
- Powerpoint Template Comparison Table
- Comparison Table Sample
- Competitive feature comparison matrix chart - Digital scouting cameras
- Feature Comparison Chart Software | Purchasing Flow Chart ...
- Feature Comparison Chart Software | Competitive feature ...
- Comparison Dashboard | Competitive feature comparison matrix ...
- Comparison Table Template
- Product Comparison Chart Excel Template
- Competitive feature comparison matrix chart - Digital scouting cameras