"Dimensions of service quality.
A customer's expectation of a particular service is determined by factors such as recommendations, personal needs and past experiences. The expected service and the perceived service sometimes may not be equal, thus leaving a gap. The service quality model or the ‘GAP model’ developed by a group of authors- Parasuraman, Zeithaml and Berry at Texas and North Carolina in 1985 , highlights the main requirements for delivering high service quality. It identifies five ‘gaps’ that cause unsuccessful delivery. Customers generally have a tendency to compare the service they 'experience' with the service they 'expect' . If the experience does not match the expectation , there arises a gap. Ten determinants that may influence the appearance of a gap were described by Parasuraman, Zeithaml and Berry. in the SERVQUAL model: reliability, responsiveness, competence, access, courtesy, communication, credibility, security, understanding the customer and tangibles.
Later, the determinants were reduced to five: tangibles; reliability; responsiveness; service assurance and empathy in the so called RATER model." [Service quality. Wikipedia]
The block diagram example "Gap model of service quality" was created using the ConceptDraw PRO diagramming and vector drawing software extended with the Block Diagrams solution from the area "What is a Diagram" of ConceptDraw Solution Park.
Block diagram

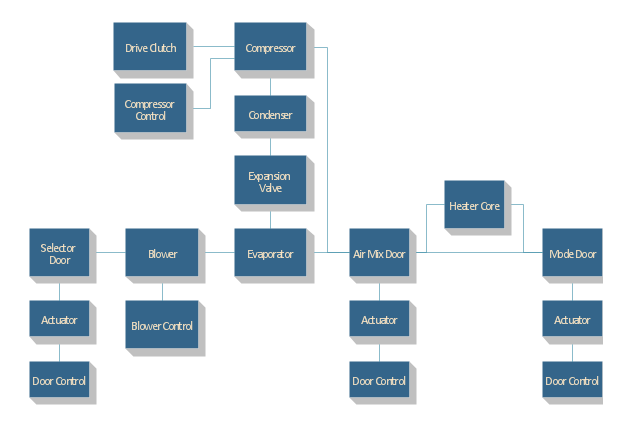
"Automobile air conditioning systems cool the occupants of a vehicle in hot weather, and have come into wide use from the late twentieth century. Air conditioners use significant power; on the other hand the drag of a car with closed windows is less than if the windows are open to cool the occupants evaporatively. There has been much debate on the effect of air conditioning on the fuel efficiency of a vehicle. Factors such as wind resistance, aerodynamics and engine power and weight have to be factored into finding the true variance between using the air conditioning system and not using it when estimating the actual fuel mileage. Other factors on the impact on the engine and an overall engine heat increase can have an impact on the cooling system of the vehicle." [Automobile air conditioning. Wikipedia]
The block diagram example "Automotive HVAC system" was created using the ConceptDraw PRO diagramming and vector drawing software extended with the Block Diagrams solution from the area "What is a Diagram" of ConceptDraw Solution Park.
The block diagram example "Automotive HVAC system" was created using the ConceptDraw PRO diagramming and vector drawing software extended with the Block Diagrams solution from the area "What is a Diagram" of ConceptDraw Solution Park.
Automotive HVAC system
Total Quality Management with ConceptDraw
 method - Fishbone diagram template")
 Fishbone Diagrams
The Fishbone Diagrams solution extends ConceptDraw PRO v10 software with the ability to easily draw the Fishbone Diagrams (Ishikawa Diagrams) to clearly see the cause and effect analysis and also problem solving. The vector graphic diagrams produced using this solution can be used in whitepapers, presentations, datasheets, posters, and published technical material.
HelpDesk
How to Create a Fishbone (Ishikawa) Diagram Quickly

Context Diagram Template

This template shows the Context Diagram. It was created in ConceptDraw PRO diagramming and vector drawing software using the Block Diagrams Solution from the “What is a Diagram” area of ConceptDraw Solution Park.
The context diagram graphically identifies the system. external factors, and relations between them. It’s a high level view of the system. The context diagrams are widely used in software engineering and systems engineering for designing the systems that process the information.
 Venn Diagrams
Venn Diagrams are actively used to illustrate simple set relationships in set theory and probability theory, logic and statistics, mathematics and computer science, linguistics, sociology, and marketing. Venn Diagrams are also often used to visually summarize the status and future viability of a project.
 Fishbone Diagram
Fishbone Diagrams solution extends ConceptDraw PRO software with templates, samples and library of vector stencils for drawing the Ishikawa diagrams for cause and effect analysis.
 Office Layout Plans
Office layouts and office plans are a special category of building plans and are often an obligatory requirement for precise and correct construction, design and exploitation office premises and business buildings. Designers and architects strive to make office plans and office floor plans simple and accurate, but at the same time unique, elegant, creative, and even extraordinary to easily increase the effectiveness of the work while attracting a large number of clients.
 Fault Tree Analysis Diagrams
This solution extends ConceptDraw PRO v9.5 or later with templates, fault tree analysis example, samples and a library of vector design elements for drawing FTA diagrams (or negative analytical trees), cause and effect diagrams and fault tree diagrams.
 SWOT and TOWS Matrix Diagrams
SWOT and TOWS Matrix Diagrams solution extends ConceptDraw PRO and ConceptDraw MINDMAP software with features, templates, samples and libraries of vector stencils for drawing SWOT and TOWS analysis matrices and mind maps.
- Factors To Consider In Drawing Of Block Diagram
- Block Diagrams
- Decision Making | Block diagram - Customer decision making ...
- Block diagram - Automotive HVAC system | Create Block Diagram ...
- HVAC Plans | Block diagram - Automotive HVAC system | Design ...
- Examples Of Block Diagrams
- SWOT Analysis | Block diagram - Porter's five forces model | SWOT ...
- Decision Making | Work Flow Diagrams with ConceptDraw PRO ...
- Block diagram - Automotive HVAC system | HVAC Plans | Block ...
- ConceptDraw PRO Compatibility with MS Visio | Block Diagram ...
- Process Flowchart | Pyramid Diagram | How To Convert a Block ...
- Block diagram - Automotive HVAC system | Block diagram ...
- Block diagram - Gap model of service quality | Block Diagram ...
- Block diagram - Automotive HVAC system | Functional Block ...
- Decision Making | Block diagram - Customer decision making ...
- Block diagram - Automotive HVAC system | HVAC Plans | Functional ...
- Block diagram - Automotive HVAC system | Car Engine Block ...
- Block diagram - Six markets model
- Relations diagram - Health care | Business Productivity ...
- 5-Set Venn diagram - Template | Workflow Diagram Template ...