This site uses cookies. By continuing to browse the ConceptDraw site you are agreeing to our Use of Site Cookies.
HelpDesk

How to Import Project Data From MS Excel File

You can import information into the project from MS Excel workbook using the entered fields - fields in which you can enter or edit information as opposed to calculated fields.
HelpDesk

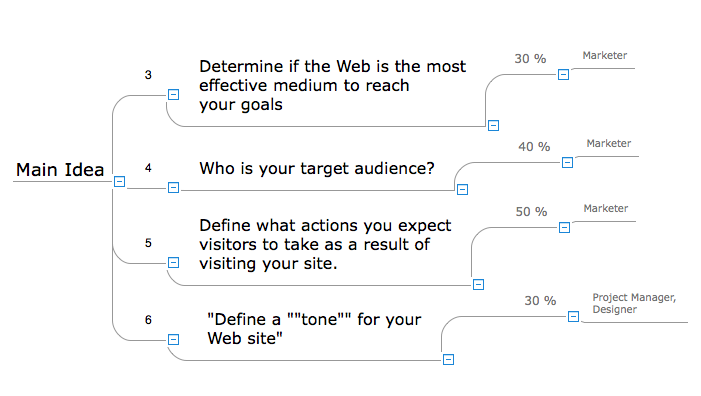
How to Input Data from MS Excel Into a Mind Map

Many people apply Excel documents to store data in the form of hierarchical lists. With ConceptDraw MINDMAP you can easily turn the linear structure of an Excel table in a radial structure of mind map ConceptDraw MINDMAP will create a mind map file (CDMZ) from your Excel (XLS) file. If you keep your information in the Microsoft Excel files, you can import them into ConceptDraw MINDMAP, converting the columns and rows to a hierarchically structured mind map. If you have multiple individual sheets in your Excel workbook, ConceptDraw MINDMAP will turn them into a single multi-page mind map. ConceptDraw MINDMAP lets you import an entire Microsoft® Excel file as well as insert data from the selected cells.
HelpDesk

How to Export Project Data to MS Excel Worksheet

You can share your ConceptDraw PROJECT files with colleagues who use MS Excel®using the export capabilities of ConceptDraw PROJECT.
HelpDesk

How to Upgrade ConceptDraw OFFICE -3

Since CS Odessa Introduced ConceptDraw Office v3 – A Powerful Collection of ConceptDraw Productivity and Project Applications for Mac and PCC, any customer who has previously purchased ConceptDraw Office vv.1,2 products is eligible for upgrade pricing. Owners of previous versions can upgrade their applications to the latest release.

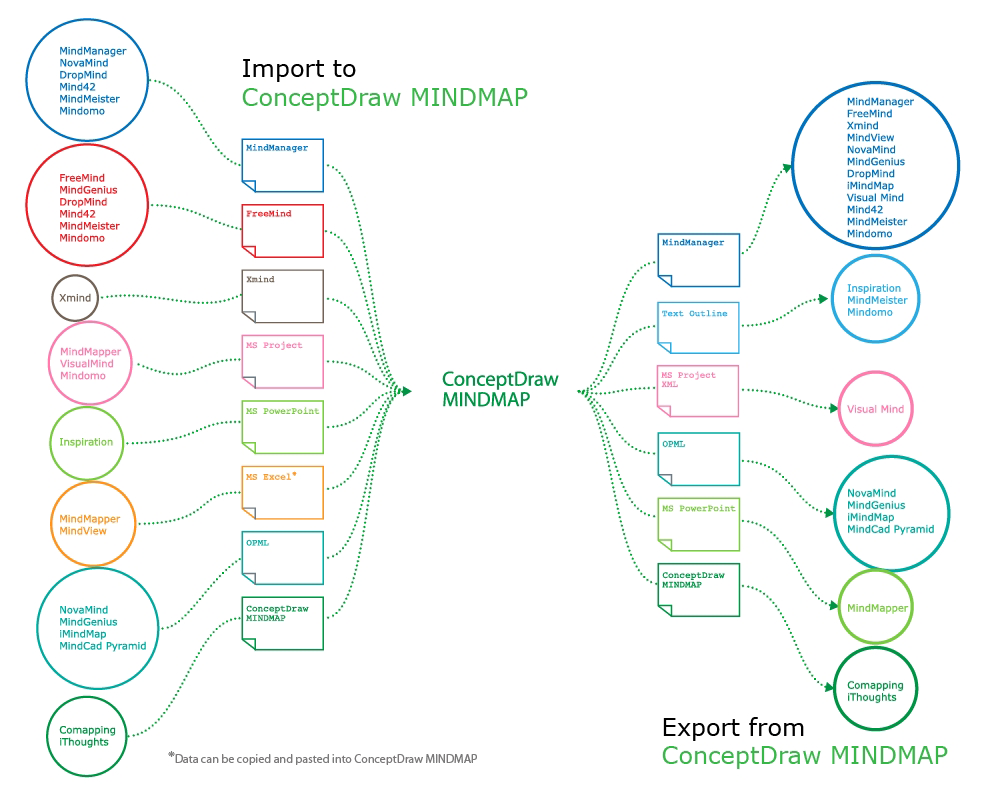
How to exchange data files of major mind mapping software?

ConceptDraw MINDMAP software included to powerful ConceptDraw Office suite is applied for professional creation the Mind Maps, for effective managing the communications within the work group or team, for holding brainstorming sessions. The ability of exchanging the documents and files of different types, including Mind Maps is very useful for users that need to collaborate, but apply varied applications in their work. ConceptDraw MINDMAP supports the export to many Microsoft Office products, such as MS Word, MS PowerPoint, MS Project, as well as export to PDF, HTML, Evernote, Apple iCal, and different graphic format files. The Mind Map Exchange solution from the Collaboration area of ConceptDraw Solution Park makes the ConceptDraw MINDMAP software powerful in questions of exchanging the Mind Maps with large variety of major mind mapping applications, including Mindjet MindManager, FreeMind, XMind. If you can't to find some file format you need at the import / export list, you can refer to the third party applications to import or export the files through them.
HelpDesk

How to Import Text to ConceptDraw MINDMAP

Mind mapping is a quick and efficient way to start up a project. When you create a mind map, it might be necessary to use previously recorded files, notes, or text outlines. The importing capabilities of ConceptDraw MINDMAP allow you to easily convert text into a mind map. You can quickly turn your TXT file to the hierarchical structure of mind map. You can convert the entire TXT file as well as a selected part. ConceptDraw MINDMAP supports the ability to convert text in both single-page and multi-page mind map. You can create a multiple page project mind map quickly, using various text work-pieces. Read this article to find out how to create your multi-page mind map from a text outline.
HelpDesk

How to Share Mind Maps via Internet

ConceptDraw MINDMAP provides a variety of export capabilities to help with that situation. Exporting the mind map to HTML format, preserving the links so they can be used to download documents.
HelpDesk

How to Use ConceptDraw Sales Dashboard Solution

An interactive visual dashboard is a valuable tool for any sales team. Sales dashboard allows you to view and monitor sales indicators that are important for manager and sales staff. It helps to use timely and reliable information to improve the quality of sales performance and increase sales revenues. ConceptDraw Sales Dashboard solution is a tool for both: sales manager and sales team. It provides the visualization of key performance indicators that are critical to the entire sales organization. The custom sales dashboard displays real-time information on sales performance KPIs with the help of intuitive and easy-to-understand diagrams and charts. Sales Dashboard helps the entire team see where they are, and what needs to be done. With ConceptDraw DIAGRAM you can easily create a visual Sales Dashboard using Live Objects Technology.
HelpDesk

How to Generate Tabular Reports in ConceptDraw PROJECT for macOS

Project reporting is one of the key functions of effective project management. Using regular project reports, project manager can constantly track and analyze the project’s execution. This analytic process can help to ensure that the team reaches the best possible solutions. ConceptDraw PROJECT is a professional software tool for project management with the advanced mechanism of reporting. You can create the set of regular reports on project activities, task statuses, cash flow and assignments in MS Excel format. Mind map reports are also available.
HelpDesk

How to Draw a Scatter Diagram

Scatter Diagrams are used to visualize how a change in one variable affects another. A Scatter Diagram displays the data as a set of points in a coordinate system. It combines these values into single data points and displays them in uneven intervals. A Scatter Diagram can be very useful for identifying relationships between variables, for example, the relationship between price and quality rating. Making a Scatter Diagram involves many different elements that can be managed using ConceptDraw Scatter Diagram solution.
HelpDesk

How to Create a Time Series Dashboard

Time Series Dashboard means integration of some type of diagrams: Line Charts, Bar Charts, Column Charts, and Dot Plots on a single space. The ConceptDraw Time Series Dashboard solution can be used to create the interactive Time Series dashboard. The libraries of Time Series Charts solution contain the Live Objects, that can change their appearance depending on the external data. Each chart from the Time Series dashboard displays particular source data. You can include Time Series Charts in your business or technical dashboards to show and compare the items changing over time.
HelpDesk

How to Send a Mind Map File to Evernote

The Note Exchange solution lets you to send a document, created with ConceptDraw MINDMAP to your Evernote account.

Cross-Functional Flowchart (Swim Lanes)

Cross-Functional Flowchart is a type of chart which shows the series of process steps connected by the arrows to depict their order and applies the swim lanes to provide an extra dimension with means of assigning each process step to certain category. Often the category or the functional unit is a stakeholder (department, person, role), resource, project, phase, or any other attribute. Cross-Functional Flowcharts visually illustrate relationships between the business processes and the functional units responsible for this processes. ConceptDraw DIAGRAM is a powerful diagramming and vector drawing software for professional design Cross-Functional Flowcharts using the common notation of shapes and swim lanes. Cross-Functional Flowcharts solution included to the Business Processes area of ConceptDraw Solution Park provides numerous well-designed vector objects and connector tools for quick, easy and effective organizing information, representing process flows and relationships, and drawing Cross-Functional Flowcharts for business, science, education, technology, etc.
HelpDesk

How to Create a PowerPoint® Presentation from a Mind Map

ConceptDraw MINDMAP allows you to create a traditional PowerPoint Presentation from your mind maps. There are two different variants when exporting to PowerPoint  - one places editable text into the template of your choice, the other places the pieces of the map that you want to show into the slides.