Business Diagram Software


Bar Diagram Math

How to Draw an Effective Workflow
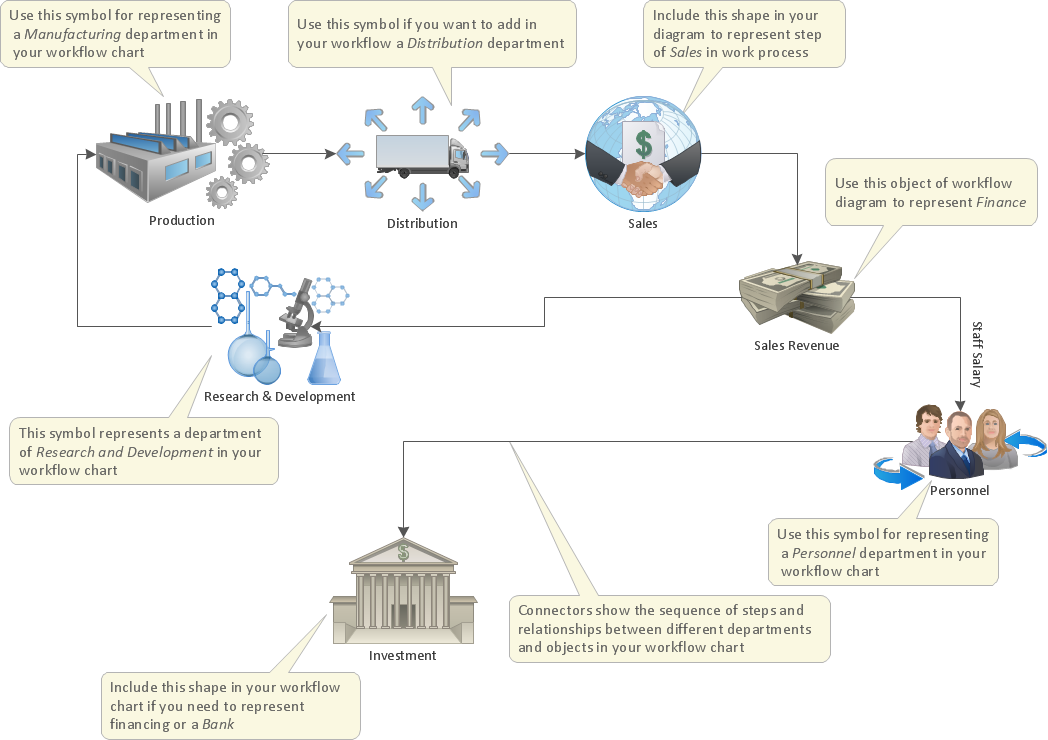
Business Processes description with ConceptDraw DIAGRAM

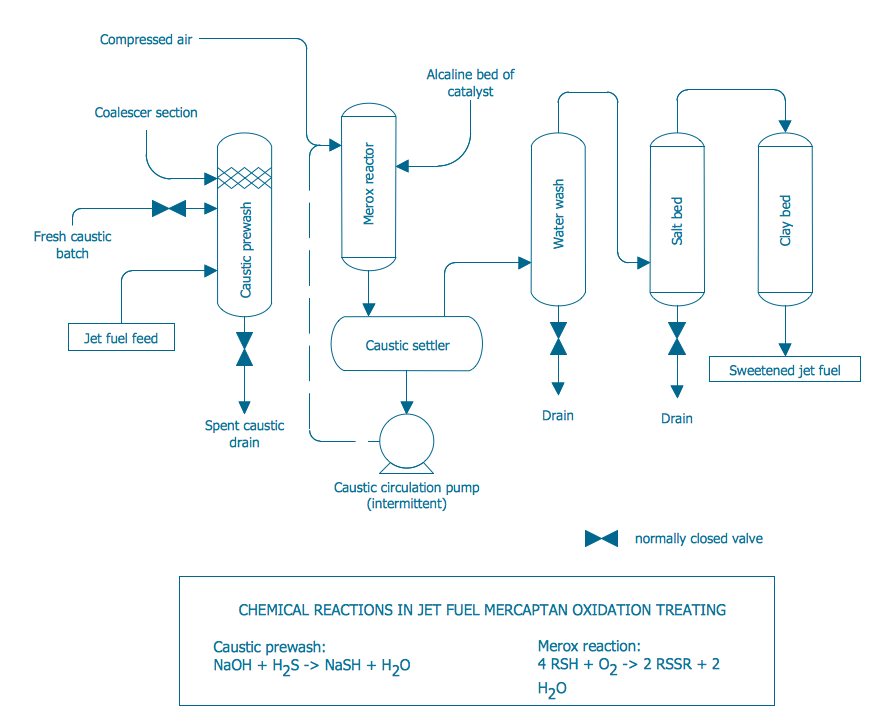
Process Diagrams
 Seven Basic Tools of Quality
Manage quality control in the workplace, using fishbone diagrams, flowcharts, Pareto charts and histograms, provided by the Seven Basic Tools of Quality solution.
 Area Charts
Area Charts are used to display the cumulative totals over time using numbers or percentages; or to show trends over time among related attributes. The Area Chart is effective when comparing two or more quantities. Each series of data is typically represented with a different color, the use of color transparency in an object’s transparency shows overlapped areas and smaller areas hidden behind larger areas.
 Block Diagrams
Block diagrams solution extends ConceptDraw DIAGRAM software with templates, samples and libraries of vector stencils for drawing the block diagrams.
 Pie Charts
Pie Charts are extensively used in statistics and business for explaining data and work results, in mass media for comparison (i.e. to visualize the percentage for the parts of one total), and in many other fields. The Pie Charts solution for ConceptDraw DIAGRAM offers powerful drawing tools, varied templates, samples, and a library of vector stencils for simple construction and design of Pie Charts, Donut Chart, and Pie Graph Worksheets.
 Business Process Model and Notation
Business Process Model and Notation Solution for ConceptDraw DIAGRAM is helpful for modeling the business processes of any degree of complexity, documenting them and effective creating diagrams using the BPMN 2.0 standard.
 Sales Dashboard
Sales Dashboard solution extends ConceptDraw DIAGRAM software with templates, samples and library of vector stencils for drawing the visual dashboards of sale metrics and key performance indicators (KPI).
 Business Intelligence Dashboard
Business Intelligence Dashboard solution extends the ConceptDraw DIAGRAM functionality with exclusive tools, numerous ready-to-use vector objects, samples and quick-start templates for creation professional Business Intelligence Dashboards, Business Intelligence Graphics, Business Intelligence Charts and Maps of different kinds. Design easy the BI dashboard, BI model or Dynamic chart in ConceptDraw DIAGRAM to monitor the company's work, to track the indicators corresponding your company's data, to display and analyze key performance indicators, to evaluate the trends and regularities of the processes occurring at the company.
 Divided Bar Diagrams
The Divided Bar Diagrams Solution extends the capabilities of ConceptDraw DIAGRAM with templates, samples, and a library of vector stencils for drawing high impact and professional Divided Bar Diagrams and Graphs, Bar Diagram Math, and Stacked Graph.
 Meter Dashboard
Meter dashboard solution extends ConceptDraw DIAGRAM software with templates, samples and vector stencils library with meter indicators for drawing visual dashboards showing quantitative data.
 Business and Finance
Use Business and Finance solution to make professional-looking documents, presentations and websites, business, finance, advertising, and project management illustrations, or any designs that requires clipart of currency, office, business, advertising, management, marketing, people, time, post, contacts, collaboration, etc.
- Process Flowchart | Sales Process Flowchart . Flowchart Examples ...
- Process Flowchart | Sales Process Flowchart . Flowchart Examples ...
- Sales Process Flowchart . Flowchart Examples | Process Flowchart ...
- Process Flowchart | Sales Process Flowchart . Flowchart Examples ...
- Revenue Dashboard Examples
- Revenue Kpi Examples
- Pie Charts | Flow Chart Symbols | Composition Dashboard | Stream ...
- Basic Flowchart Symbols and Meaning | Process Flowchart | Cross ...
- Process Flowchart | Sales Process Flowchart . Flowchart Examples ...
- Sales Process Flowchart . Flowchart Examples | Sales Process ...
- Business Models | Entity Relationship Diagram Examples | Types of ...
- Process Flowchart | Flow chart Example . Warehouse Flowchart ...
- Composition of state government revenue in 2006‑07 | Bar Diagram ...
- Process Flowchart | Basic Flowchart Symbols and Meaning | Flow ...
- Process Flowchart | Business Process Diagrams | Basic Flowchart ...
- Sales Process Flowchart . Flowchart Examples | Sales Process Map ...
- Quality Control Chart Software — ISO Flowcharting | Definition TQM ...
- Types of Flowchart - Overview | Hiring process workflow | Process ...
- Charts On Disaster Management