This site uses cookies. By continuing to browse the ConceptDraw site you are agreeing to our Use of Site Cookies.

entity-relationship diagram, ER-diagram, database ERD Entity-Relationship Diagram (ERD)

entity-relationship diagram, ER-diagram, database ERD
An Entity-Relationship Diagram (ERD) is a visual presentation of entities and relationships. That type of diagrams is often used in the semi-structured or unstructured data in databases and information systems. At first glance ERD is similar to a flowch

Data Modeling with Entity Relationship Diagram

Data modeling is actively applied in analysis and uses wide set of methods for description the data requirements in a system. One of the most popular and well-known is the ERD method of database modeling.
The best ERD tool for the Mac and Windows is ConceptDraw DIAGRAM software extended with the Entity-Relationship Diagram (ERD) solution from the Software Development Area for ConceptDraw Solution Park, which is sharpened for professional ERD drawing and data modeling with Entity Relationship Diagram.

ER Diagram Tool

Creating of Entity-Relationship Diagrams (ERDs) is a complex process that requires convenient, automated tools. ConceptDraw DIAGRAM diagramming and vector drawing software offers a powerful ER Diagram Tool - the Entity-Relationship Diagram (ERD) Solution from the Software Development Area.

Developing Entity Relationship Diagrams

When you need to visually represent the structure of relational database, Entity relationship diagram (ERD) is a type of diagram for that case.
Most entity-relationship diagrams can be built with objects from Flowchart solution or ERD Solution which contains inbuilt templates. Follow these steps to create your own custom ERD diagram.
Don't be frightened if it looks complex, ConceptDraw DIAGRAM makes it easy to create an ERD, and hundreds of other diagrams, in minutes.

Entity Relationship Diagram Software for Mac

One of the most popular semantic data models is the "entity-relationship" model (often called ER-model). Most of the modern approaches to the database (mainly relational) design are based on the usage of different versions of ER- model. Domain modeling is based on the use of graphic charts, including a small number of heterogeneous components. The simplicity and the presentation clarity of the conceptual basis of these ER-model schemes led to its widespread deployment in the CASE-systems that support automatic design of relational databases.
A relation is a graphically depicted association between two entities. As well as the entity, a relation is a typical concept, all instances of the linked entity types are subject to the rules established by the connecting. Therefore, it is more correct to speak about the relationship type made between types of entities and about the instances of relationship types made between instances of the entity type. In common ER-model this association is a

Software development with ConceptDraw DIAGRAM

ConceptDraw possesses powerful tools for designing of technical documentation for object-oriented projects. The libraries included in the package allow to easily draw class hierarchies, object hierarchies and diagrams of data flows with the use of the most popular notations, including UML and Booch notations.

UML Use Case Diagram Example. Registration System

The use case diagram (behavior scenarios, precedents) is the initial conceptual representation of the system during its design and development. This diagram consists of actors, use cases and relationships between them. When constructing a diagram, common notation elements can also be used: notes and extension mechanisms.

This sample was created in ConceptDraw DIAGRAM diagramming and vector drawing software using the UML Use Case Diagram library of the Rapid UML Solution from the Software Development area of ConceptDraw Solution Park.
This sample shows the types of user’s interactions with the system and is used at the registration and working with the database system.

Beauty in nature Illustrations and Clipart

Nature solution expands our software possibilities to create beautiful illustrations and cliparts with the new library which contains 17 vector objects.

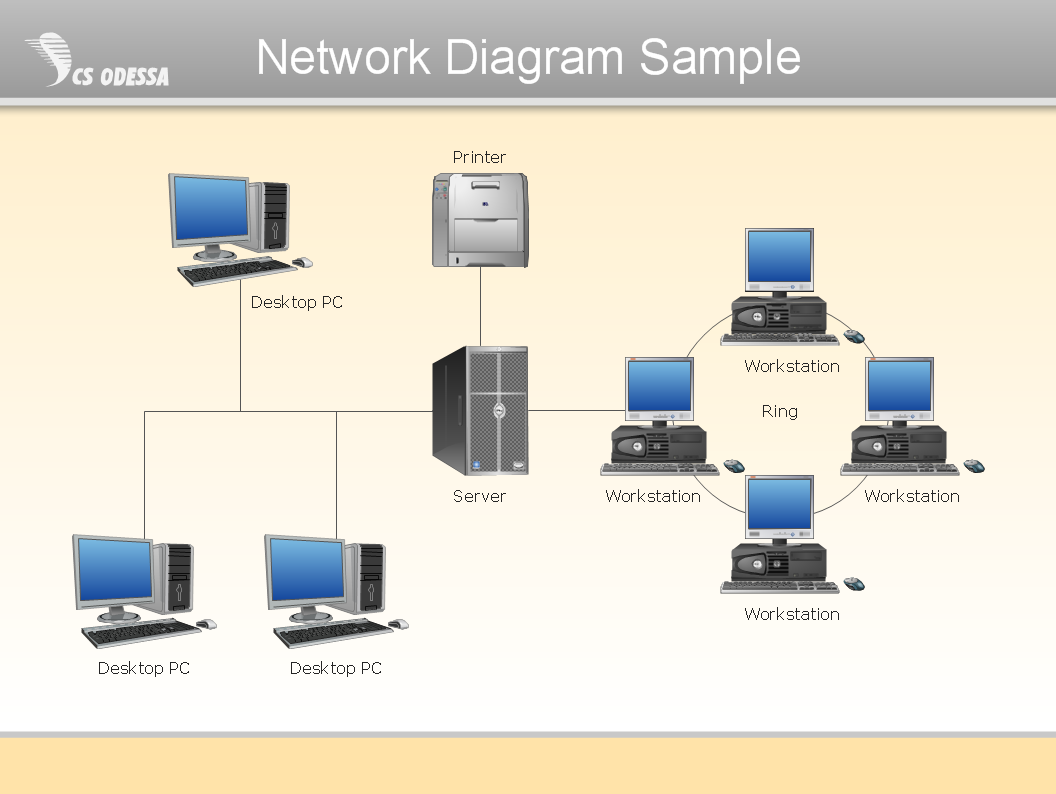
Network Diagram Software Physical Network Diagram

ConceptDraw Network Diagram Software is ideal for network engineers and network designers who need to draw Physical Network Diagrams.

UML Class Diagram Notation

When it comes to system construction, a class diagram is the most widely used diagram. UML Class Diagrams is a type of static structure diagram that is used for general conceptual modeling of the systematics of the application. Such a diagram would illustrate the object-oriented view of a system. The object orientation of a system is indicated by a class diagram. It describes the structure of a system by showing the general issues,classes of a system, attributes, operations, interfaces, inheritance, and the relationships between them.