Chart Audit

Circular Diagram

Marketing Charts

Business Process Workflow Diagrams & Software


Cause and Effect Analysis


Affinity Diagram

Six Markets Model Chart

Manage Social Media Response Plan DFD

Diagramming Software for Design UML Interaction Overview Diagrams


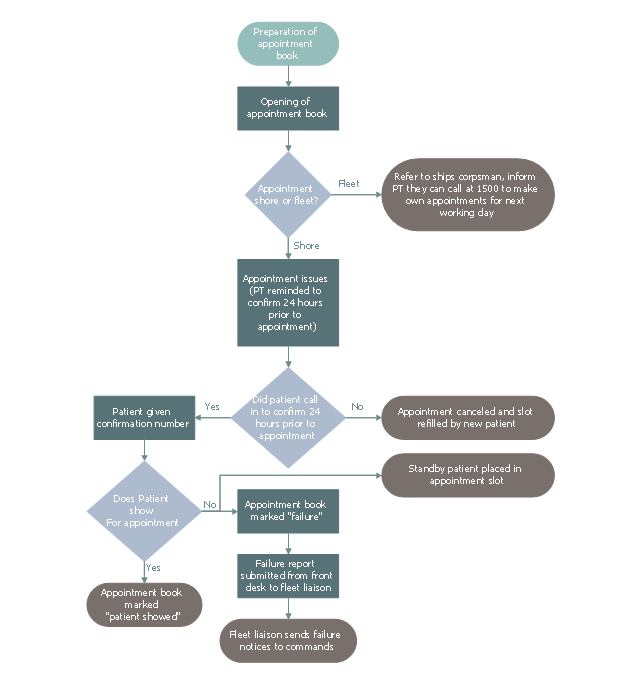
This business process flowchart example was redesigned from the Wikimedia Commons file: Proposed Patient Appointment Procedure.png.
[commons.wikimedia.org/ wiki/ File:Proposed_ Patient_ Appointment_ Procedure.png]
"The example is Proposed Patient Appointment Procedure. It starts with "preparation of appointment book" followed by a decision whether the appointment is shore or fleet. If the appointment is fleet, inform patient they can call 1500 to make own appointments for next few days, if the appointment is shore, confirm 24 hours prior to appointment. Next confirm that the patient confirmed. If a patient did not call, the appointment is canceled, otherwise the patient is given a confirmation number. Finally confirm that the patient showed for the appointment. If not, a standby patient is placed in the appointment slot, the appointment book is marked “Failure” and a failure report is submitted from front desk to fleet liaison. If a patient showed for appointment, put “Patient showed” in appointment book." [Business process mapping. Wikipedia]
The business process map "Proposed Patient Appointment Procedure" was drawn using the ConceptDraw PRO diagramming and business graphics software extended with the Business Process Mapping solution from the Business Processes area of ConceptDraw Solution Park.
Business process map
- Flowchart Example: Flow Chart of Marketing Analysis | Competitor ...
- Flowchart Example: Flow Chart of Marketing Analysis | Financial ...
- Competitor Analysis | Flowchart Example: Flow Chart of Marketing ...
- Marketing Analysis Diagram | Flowchart Example: Flow Chart of ...
- HVAC Marketing Plan | Flowchart Example: Flow Chart of Marketing ...
- Basic Audit Flowchart. Flowchart Examples | Audit Flowchart Symbols
- Marketing Flow Chart | Flowchart Marketing Process. Flowchart ...
- Flowchart Example: Flow Chart of Marketing Analysis | Marketing ...
- Marketing | Flowchart Example: Flow Chart of Marketing Analysis ...
- Flowchart Example: Flow Chart of Marketing Analysis | Flowchart ...