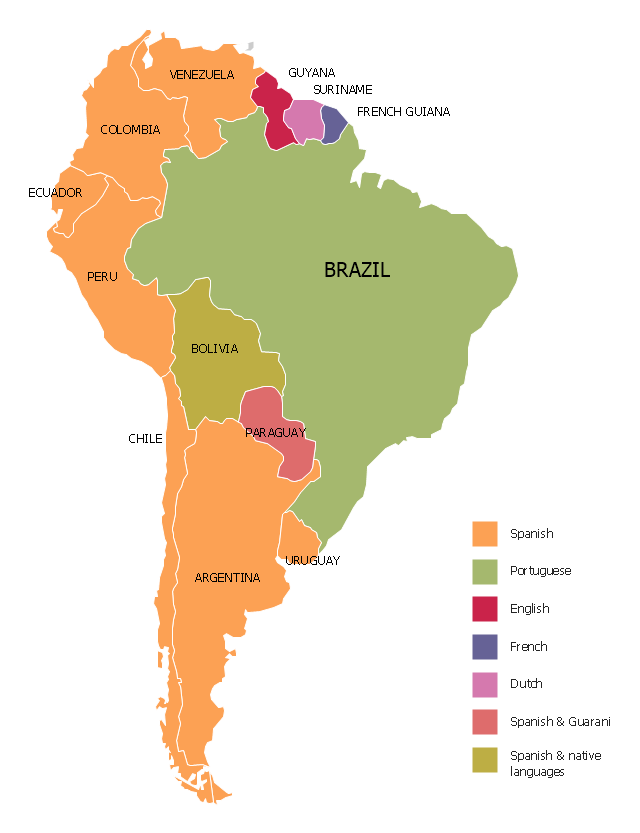
"Spanish and Portuguese are the most spoken languages in South America, with approximately 200 million speakers each. Spanish is the official language of most countries, along with other native languages in some countries. Portuguese is the official language of Brazil. Dutch is the official language of Suriname; English is the official language of Guyana, although there are at least twelve other languages spoken in the country, including Hindi and Arabic. English is also spoken in the Falkland Islands. French is the official language of French Guiana and the second language in Amapá, Brazil.
Indigenous languages of South America include Quechua in Ecuador, Peru, Chile, Argentina, Colombia, and Bolivia; Wayuunaiki in northern Colombia (La Guajira); Guaraní in Paraguay and, to a much lesser extent, in Bolivia; Aymara in Bolivia, Peru, and less often in Chile; and Mapudungun is spoken in certain pockets of southern Chile and, more rarely, Argentina. At least three South American indigenous languages (Quechua, Aymara, and Guarani) are recognized along with Spanish as national languages." [South America. Wikipedia]
The Languages of South America map example was redesigned from Wikimedia Commons file: Languages of South America (en).svg.
[commons.wikimedia.org/ wiki/ File:Languages_ of_ South_ America_ (en).svg]
This file is licensed under the Creative Commons Attribution-Share Alike 3.0 Unported license. [creativecommons.org/ licenses/ by-sa/ 3.0/ deed.en]
The Languages of South America map example was drawn using ConceptDraw PRO diagramming and vector drawing software extended with design elements library South America.
The Languages of South America map example is included in the Continent Maps solution from the Maps area of ConceptDraw Solution Park.
Thematic map - South America
"A thematic map is a type of map or chart especially designed to show a particular theme connected with a specific geographic area. ...
A thematic map is a map that focuses on a specific theme or subject area, whereas in a general map the variety of phenomena - geological, geographical, political - regularly appear together. ...
Thematic maps emphasize spatial variation of one or a small number of geographic distributions. These distributions may be physical phenomena such as climate or human characteristics such as population density and health issues. ...
Thematic map are sometimes referred to as graphic essays that portray spatial variations and interrelationships of geographical distributions. Location, of course, is important to provide a reference base of where selected phenomena are occurring. ...
Thematic maps serve three primary purposes.
First, they provide specific information about particular locations.
Second, they provide general information about spatial patterns.
Third, they can be used to compare patterns on two or more maps." [Thematic map. Wikipedia]
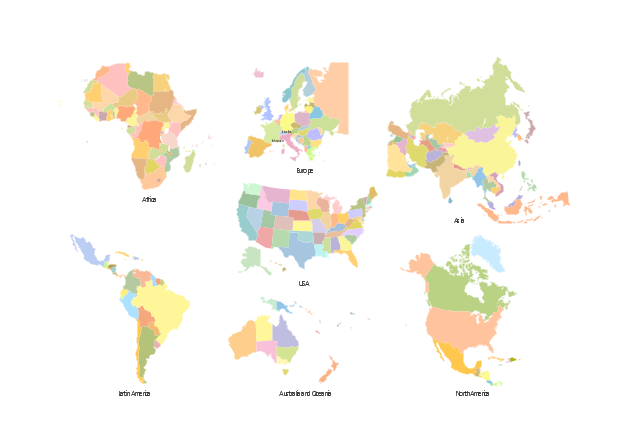
The vector stencils library "Thematic maps" contains 7 continent map contours for creating the thematic maps of geographic regions displaying the metric values by countries, states and territories marked by different colors.
Use the design elements library "Thematic maps" to create spatial dashboards using the ConceptDraw PRO diagramming and vector drawing software for your Spatial Intelligence and Location Intelligence business practice.
The example "Design elements - Thematic maps" is included in the Spatial Dashboard solution from the area "What is a Dashboard" of ConceptDraw Solution Park.
A thematic map is a map that focuses on a specific theme or subject area, whereas in a general map the variety of phenomena - geological, geographical, political - regularly appear together. ...
Thematic maps emphasize spatial variation of one or a small number of geographic distributions. These distributions may be physical phenomena such as climate or human characteristics such as population density and health issues. ...
Thematic map are sometimes referred to as graphic essays that portray spatial variations and interrelationships of geographical distributions. Location, of course, is important to provide a reference base of where selected phenomena are occurring. ...
Thematic maps serve three primary purposes.
First, they provide specific information about particular locations.
Second, they provide general information about spatial patterns.
Third, they can be used to compare patterns on two or more maps." [Thematic map. Wikipedia]
The vector stencils library "Thematic maps" contains 7 continent map contours for creating the thematic maps of geographic regions displaying the metric values by countries, states and territories marked by different colors.
Use the design elements library "Thematic maps" to create spatial dashboards using the ConceptDraw PRO diagramming and vector drawing software for your Spatial Intelligence and Location Intelligence business practice.
The example "Design elements - Thematic maps" is included in the Spatial Dashboard solution from the area "What is a Dashboard" of ConceptDraw Solution Park.
Thematic map templates
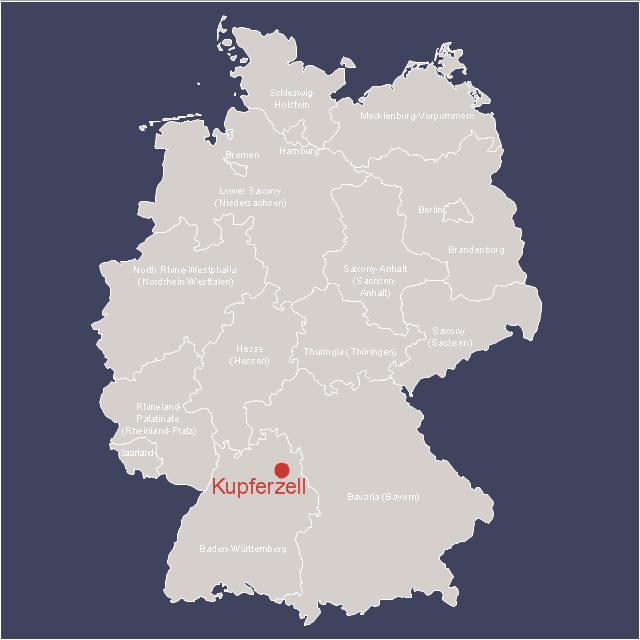
This Germany thematic map example was created on the base of Wikimedia Commons file: Batrachotomus Germany localisation map.jpg. [commons.wikimedia.org/ wiki/ File:Batrachotomus_ Germany_ localisation_ map.jpg]
"Batrachotomus is a genus of prehistoric archosaur. Fossils of this animal have been found in southern Germany and dated from the Ladinian stage of the Middle Triassic period, around 228 to 231 million years ago. Batrachotomus was described by palaeontologist David J. Gower 22 years after its discovery." [Batrachotomus. Wikipedia]
The thematic map example "Batrachotomus Germany localisation map" was designed using the ConceptDraw PRO software extended with the Map of Germany solution from the Maps area of ConceptDraw Solution Park.
Germany thematic map example
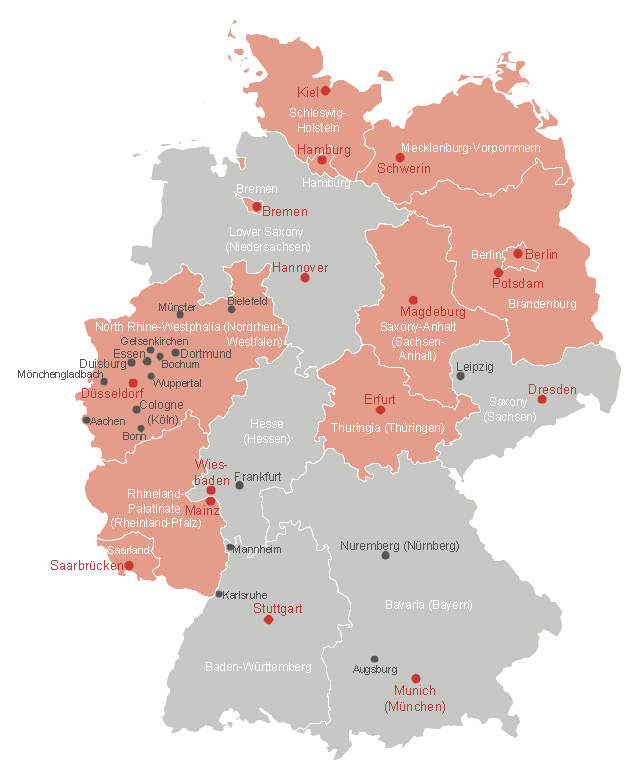
This Germany thematic map example was created on the base of Wikimedia Commons file: Deutschland Bundesländer mit Informationsfreiheitsgesetzgebung.svg. [commons.wikimedia.org/ wiki/ File:Deutschland_ Bundesl%C3%A4nder_ mit_ Informationsfreiheitsgesetzgebung.svg]
This file is licensed under the Creative Commons Attribution-Share Alike 2.0 license. [creativecommons.org/ licenses/ by-sa/ 2.0]
"In Germany, the federal government passed a freedom of information law on September 5, 2005; it was last updated on August 7, 2013. The law grants each person an unconditional right to access official federal information. No legal, commercial, or any other kind of justification is necessary.
Nine of the sixteen Bundesländer—Berlin, Brandenburg, Nordrhein-Westfalen, Schleswig-Holstein, Hamburg, Bremen, Mecklenburg-Vorpommern, Saarland and Thüringen—have approved individual "Informationsfreiheitsgesetze" (Freedom of Information laws)." [Germany. Freedom of information laws by country. Wikipedia]
The thematic map example "Map - States of Germany with Freedom of Information Legislation" was designed using the ConceptDraw PRO software extended with the Map of Germany solution from the Maps area of ConceptDraw Solution Park.
Germany thematic map example
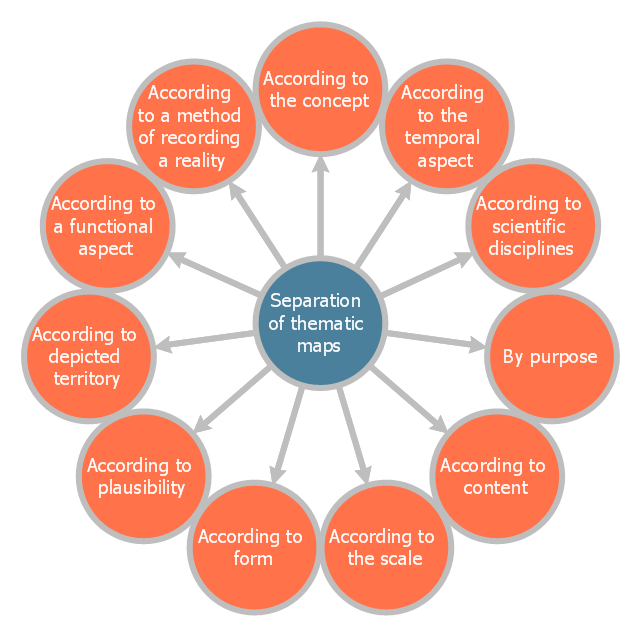
This circle-spoke diagram sample shows the basic division of thematic maps. It was designed on the base of the Wikimedia Commons file: Dělení tematických map.png.
[commons.wikimedia.org/ wiki/ File:D%C4%9Blen%C3%AD_ tematick%C3%BDch_ map.png]
This file is licensed under the Creative Commons Attribution-Share Alike 4.0 International license. [creativecommons.org/ licenses/ by-sa/ 4.0/ deed.en]
"A thematic map is a map that focuses on a specific theme or subject area. This is in contrast to general reference maps, which regularly show the variety of phenomena — geological, geographical, political — together. The contrast between them lies in the fact that thematic maps use the base data, such as coastlines, boundaries and places, only as points of reference for the phenomenon being mapped. General maps portray the base data, such as landforms, lines of transportation, settlements, and political boundaries, for their own sake.
Thematic maps emphasize spatial variation of one or a small number of geographic distributions. These distributions may be physical phenomena such as climate or human characteristics such as population density and health issues." [Thematic map. Wikipedia]
The hub-and-spoke diagram example "Division of thematic maps" was created using the ConceptDraw PRO diagramming and vector drawing software extended with the Circle-Spoke Diagrams solution from the area "What is a Diagram" of ConceptDraw Solution Park.
Circle-spoke diagram
This example was created on the base of thematic map "Germany: Sugarbeets. Percent of total area by state" from the website of the U.S. Department of Agriculture. [usda.gov/ oce/ weather/ pubs/ Other/ MWCACP/ Graphs/ eur/ grmsugb.gif]
"Sugar beet, cultivated Beta vulgaris, is a plant whose root contains a high concentration of sucrose. It is grown commercially for sugar production.
In 2011, France, the United States, Germany, Russia, and Ukraine were the world's five largest sugar beet producers by mass, whilst by value Turkey takes the place of Ukraine. However, in 2010–2011, North America, Western Europe, and Eastern Europe did not produce enough sugar from sugar beets to meet overall demand for sugar, and were all net importers of sugar. ... In 2009, sugar beets accounted for 20% of the world's sugar production." [Sugar beet. Wikipedia]
The thematic map example "Germany crop areas map - Sugar beets" was designed using the ConceptDraw PRO software extended with the Map of Germany solution from the Maps area of ConceptDraw Solution Park.
Germany thematic map example

Excellent Examples of Infographic Maps
 USA Maps
Use the USA Maps solution to create a map of USA, a US interstate map, printable US maps, US maps with cities and US maps with capitals. Create a complete USA states map.
The healthcare management infographics example "Confirmed cases of swine flu in Australia" was redesigned from the Wikimedia Commons file: H1N1 Australia Confirmed Map.svg.
[commons.wikimedia.org/ wiki/ File:H1N1_ Australia_ Confirmed_ Map.svg]
"Swine influenza, also called pig influenza, swine flu, hog flu and pig flu, is an infection caused by any one of several types of swine influenza viruses. Swine influenza virus (SIV) or swine-origin influenza virus (S-OIV) is any strain of the influenza family of viruses that is endemic in pigs. As of 2009, the known SIV strains include influenza C and the subtypes of influenza A known as H1N1, H1N2, H2N1, H3N1, H3N2, and H2N3.
Swine influenza virus is common throughout pig populations worldwide. Transmission of the virus from pigs to humans is not common and does not always lead to human flu, often resulting only in the production of antibodies in the blood. If transmission does cause human flu, it is called zoonotic swine flu. People with regular exposure to pigs are at increased risk of swine flu infection.
Around the mid-20th century, identification of influenza subtypes became possible, allowing accurate diagnosis of transmission to humans. Since then, only 50 such transmissions have been confirmed. These strains of swine flu rarely pass from human to human. Symptoms of zoonotic swine flu in humans are similar to those of influenza and of influenza-like illness in general, namely chills, fever, sore throat, muscle pains, severe headache, coughing, weakness and general discomfort." [Swine influenza
From Wikipedia]
The thematic map example "Confirmed cases of swine flu in Australia" was created using the ConceptDraw PRO diagramming and vector drawing software extended with the Management Infographics solition from the area "Business Infographics" in ConceptDraw Solution Park.
Australia thematic map example

 Germany Map
The Germany Map solution contains collection of samples, templates and scalable vector stencil graphic maps, representing map of Germany and all 16 states of Germany. Use the Germany Map solution from ConceptDraw Solution Park as the base for various them
- Examples Of Thematic Maps
- Languages of South America - Thematic map | Design elements ...
- Us Thematic Map Example
- Languages of South America - Thematic map | Geo Map - South ...
- Visualization Spatial Data Using Thematic Maps Combined with ...
- North America Thematic Map
- Languages of South America - Thematic map | North America map ...
- Design elements - Thematic maps | Name Three Primary Purposes ...
- Design elements - Thematic maps | Spatial Dashboard | Spatial ...