Sales Growth. Bar Graphs Example
This sample was created in ConceptDraw DIAGRAM diagramming and vector drawing software using the Bar Graphs Solution from Graphs and Charts area of ConceptDraw Solution Park. It is Bar Graphs example, Sales Growth example, Column Chart Example - Sales Report.JSD - Jackson system development
Jackson System Development (JSD) is a linear method of system development created by Michael A. Jackson and John Cameron in the 1980s. It comprises the whole software life cycle directly or providing a framework for more specialized techniques.When implementing the Jackson System Development method and designing JSD diagrams, you can succesfully use the powerful and helpful tools of ConceptDraw DIAGRAM software extended with Entity-Relationship Diagram (ERD) solution from the Software Development area of ConceptDraw Solution Park.
Software Diagram Examples and Templates
ConceptDraw DIAGRAM is a powerful tool for business and technical diagramming.Software Development area of ConceptDraw Solution Park provides 5 solutions:
Data Flow Diagrams, Entity-Relationship Diagram (ERD), Graphic User Interface, IDEFO Diagrams, Rapid UML.
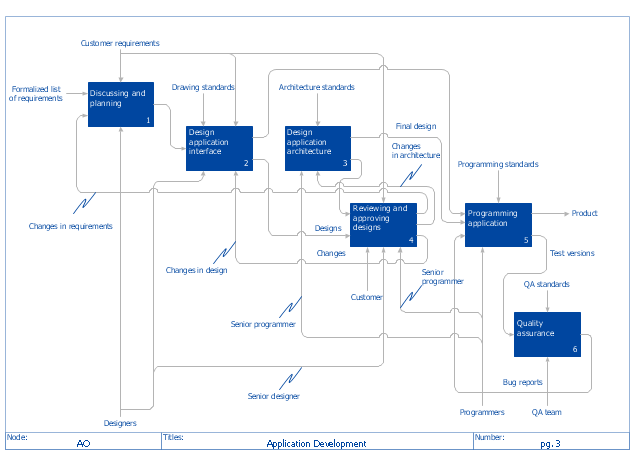
"The IDEF0 Functional Modeling method is designed to model the decisions, actions, and activities of an organization or system. ...
IDEF0 includes both a definition of a graphical modeling language (syntax and semantics) and a description of a comprehensive methodology for developing models. ...
IDEF0 is used to show data flow, system control, and the functional flow of lifecycle processes. IDEF0 is capable of graphically representing a wide variety of business, manufacturing and other types of enterprise operations to any level of detail. It provides rigorous and precise description, and promotes consistency of usage and interpretation." [IDEF0. Wikipedia]
The IDEF0 diagram example "Application development" was created using the ConceptDraw PRO diagramming and vector drawing software extended with the IDEF0 Diagrams solution from the Software Development area of ConceptDraw Solution Park.
Entity Relationship Diagram Software Engineering
Entity Relationship Diagram (aka ERD, ER Diagram, E-R Diagram) is a well-tried software engineering tool for data modeling, system design and illustrating the logical structure of databases.Professional ERD drawing is an essential software engineering method for database modeling. ConceptDraw DIAGRAM as a powerful Entity Relationship Diagram Software Engineering offers the tools of Entity-Relationship Diagram (ERD) solution from Software Development area of ConceptDraw Solution Park.
Human Resource Development
Human Resource Development (HRD) focuses on the help employees develop their personal and organizational skills, abilities, and knowledge, HRD also helps to adapt an organization to the changing of external environment.ConceptDraw DIAGRAM diagramming and vector drawing software supplied with HR Flowcharts Solution from the Management Area of ConceptDraw Solution Park can effectively help in labour-intensive process of human resource development.
UML Deployment Diagram Example - ATM System UML diagrams
This sample was created in ConceptDraw DIAGRAM diagramming and vector drawing software using the UML Deployment Diagram library of the Rapid UML Solution from the Software Development area of ConceptDraw Solution Park.This sample shows the work of the ATM (Automated Teller Machine) banking system that is used for service and performing of the banking transactions using ATMs. System engineers can use comprehensive UML diagrams solution.
Basic Flowchart Symbols and Meaning
Flowchart Symbols and Meaning - Provides a visual representation of basic flowchart symbols and their proposed use in professional workflow diagram, standard process flow diagram and communicating the structure of a well-developed web site, as well as their correlation in developing on-line instructional projects. See flowchart's symbols by specifics of process flow diagram symbols and workflow diagram symbols.Data Flow Diagram Example
ConceptDraw DIAGRAM extended with Data Flow Diagrams solution is the best diagramming and vector drawing software for quick and easy designing the Data Flow Diagram Example of any complexity.
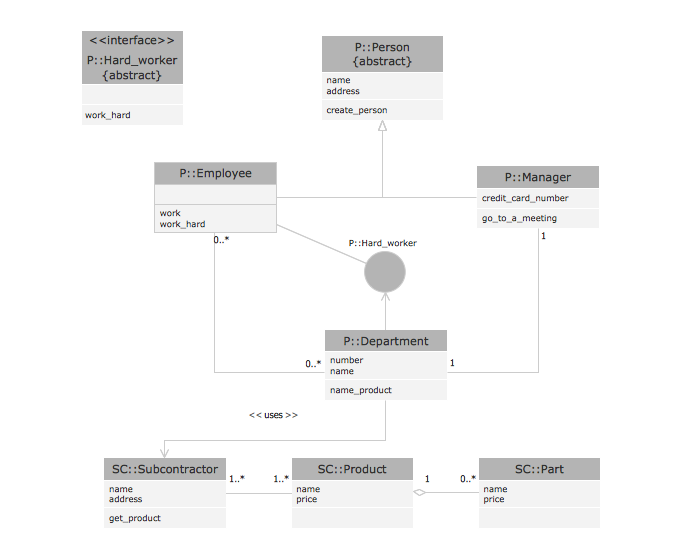
Examples for OOSE Method
This example shows the OOSE method. It was created in ConceptDraw DIAGRAM diagramming and vector drawing software using the Rapid UML Solution from the Software Development area of ConceptDraw Solution Park.- Site Development Plan Example
- Systems development life cycle | SSADM Diagram | Process ...
- Flowchart Examples Website Development Project
- Swot Analysis For Business Development Department
- Gantt Chart For Software Development Sample
- Venn Diagram Examples for Problem Solving. Environmental Social ...
- Fishbone Diagram Example Software Development
- Examples Of A Development Project Flow Chart
- Histogram Example For Software Development
- Sales Growth . Bar Graphs Example | Bar Diagrams for Problem ...
- ERD | Entity Relationship Diagrams, ERD Software for Mac and Win
- Flowchart | Basic Flowchart Symbols and Meaning
- Flowchart | Flowchart Design - Symbols, Shapes, Stencils and Icons
- Flowchart | Flow Chart Symbols
- Electrical | Electrical Drawing - Wiring and Circuits Schematics
- Flowchart | Common Flowchart Symbols