This divided bar chart sample shows the petroleum products yielded from 1 barrel of crude oil in California in 2004. It was drawn using data from the chart on the California Energy Almanac website. [energyalmanac.ca.gov/ gasoline/ whats_ in_ barrel_ oil.html]
"Petroleum products are useful materials derived from crude oil (petroleum) as it is processed in oil refineries. Unlike petrochemicals, which are a collection of well-defined usually pure chemical compounds, petroleum products are complex mixtures. The majority of petroleum is converted to petroleum products, which includes several classes of fuels.
According to the composition of the crude oil and depending on the demands of the market, refineries can produce different shares of petroleum products. The largest share of oil products is used as "energy carriers", i.e. various grades of fuel oil and gasoline. These fuels include or can be blended to give gasoline, jet fuel, diesel fuel, heating oil, and heavier fuel oils. Heavier (less volatile) fractions can also be used to produce asphalt, tar, paraffin wax, lubricating and other heavy oils. Refineries also produce other chemicals, some of which are used in chemical processes to produce plastics and other useful materials. Since petroleum often contains a few percent sulfur-containing molecules, elemental sulfur is also often produced as a petroleum product. Carbon, in the form of petroleum coke, and hydrogen may also be produced as petroleum products. The hydrogen produced is often used as an intermediate product for other oil refinery processes such as hydrocracking and hydrodesulfurization." [Petroleum product. Wikipedia]
The chart example "Petroleum products yielded from one barrel of crude oil" was created using the ConceptDraw PRO diagramming and vector drawing software extended with the Divided Bar Diagrams solution from the Graphs and Charts area of ConceptDraw Solution Park.
Divided bar chart

Types of Flowcharts


Accounting Flowchart Symbols

Process Flow Chart

Process Flow Diagram

 Basic Divided Bar Diagrams
This solution extends the capabilities of ConceptDraw PRO v10.3.0 (or later) with templates, samples and a library of vector stencils for drawing Divided Bar diagrams.
 Divided Bar Diagrams
The Divided Bar Diagrams Solution extends the capabilities of ConceptDraw PRO v10 with templates, samples, and a library of vector stencils for drawing high impact and professional Divided Bar Diagrams and Graphs, Bar Diagram Math, and Stacked Graph.
The vector stencils library "Resources and energy" contains 19 clipart images for drawing illustrations on resources and energy.
"Natural resources occur naturally within environments that exist relatively undisturbed by humanity, in a natural form. A natural resource is often characterized by amounts of biodiversity and geodiversity existent in various ecosystems.
Natural resources are derived from the environment. Some of them are essential for our survival while most are used for satisfying our wants. Natural resources may be further classified in different ways.
Natural resources are materials and components (something that can be used) that can be found within the environment. Every man-made product is composed of natural resources (at its fundamental level). A natural resource may exist as a separate entity such as fresh water, and air, as well as a living organism such as a fish, or it may exist in an alternate form which must be processed to obtain the resource such as metal ores, oil, and most forms of energy." [Natural resource. Wikipedia]
The clip art example "Resources and energy - Vector stencils library" was created in ConceptDraw PRO diagramming and vector drawing software using the Manufacturing and Maintenance solution from the Illustration area of ConceptDraw Solution Park.
Human resources

Batteries

Wind turbine

Transmission tower

Natural gas burner

Solar panel

Lightning

Ionizing radiation hazard sign

High voltage symbol

Atom

Incandescent light bulb

Oil barrels

Power station

Wood

Perpetuum mobile

Hydroelectric dam

Liquefied petroleum gas

Natural gas

Minecart with coal

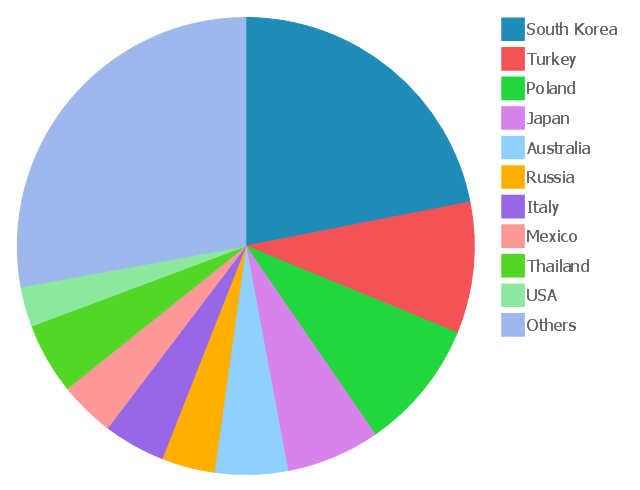
This pie chart sample shows 2008 autogas consumption by countries. It was designed on the base of the Wikimedia Commons file: 2008 autogas consumption.jpg.
[commons.wikimedia.org/ wiki/ File:2008_ autogas_ consumption.jpg]
This file is licensed under the Creative Commons Attribution-Share Alike 3.0 Unported license. [creativecommons.org/ licenses/ by-sa/ 3.0/ deed.en]
"Autogas is the common name for liquefied petroleum gas (LPG) when it is used as a fuel in internal combustion engines in vehicles as well as in stationary applications such as generators. It is a mixture of propane and butane.
Autogas is widely used as a "green" fuel, as it decreases exhaust emissions. In particular, it reduces CO2 emissions by around 25% compared to petrol. ...
It has an octane rating (MON/ RON) that is between 90 and 110 and an energy content (higher heating value - HHV) that is between 25.5 megajoules per litre (for pure propane) and 28.7 megajoules per litre (for pure butane) depending upon the actual fuel composition.
Autogas is the third most popular automotive fuel in the world, with approximately 16 million of 600 million passenger cars powered using the fuel, representing less than 3% of the total market share." [Autogas. Wikipedia]
The pie chart example "2008 Autogas consumption" was created using the ConceptDraw PRO diagramming and vector drawing software extended with the Pie Charts solutiton of the Graphs and Charts area in ConceptDraw Solution Park.
Pie chart
 Chemical and Process Engineering
This chemical engineering solution extends ConceptDraw PRO v.9.5 (or later) with process flow diagram symbols, samples, process diagrams templates and libraries of design elements for creating process and instrumentation diagrams, block flow diagrams (BFD
- Atmosphere air composition | Design elements - Composition charts ...
- A Drawing Of Composition Of Market
- Process flow diagram - Typical oil refinery | Crude oil distillation unit ...
- Process flow diagram - Typical oil refinery | Petroleum products ...
- Petroleum products yielded from one barrel of crude oil | Resources ...
- Petroleum products yielded from one barrel of crude oil | Bar ...
- Drawing Composition Of Market
- Flow Chart Of Extraction Of Petroleum Products
- Petroleum products yielded from one barrel of crude oil | Process ...
- Petroleum products yielded from one barrel of crude oil | Basic ...