Software Diagram Examples and Templates

Entity Relationship Diagram Software Engineering

Entity Relationship Diagram Examples


Diagramming Software for Design UML Use Case Diagrams


Bank UML Diagram
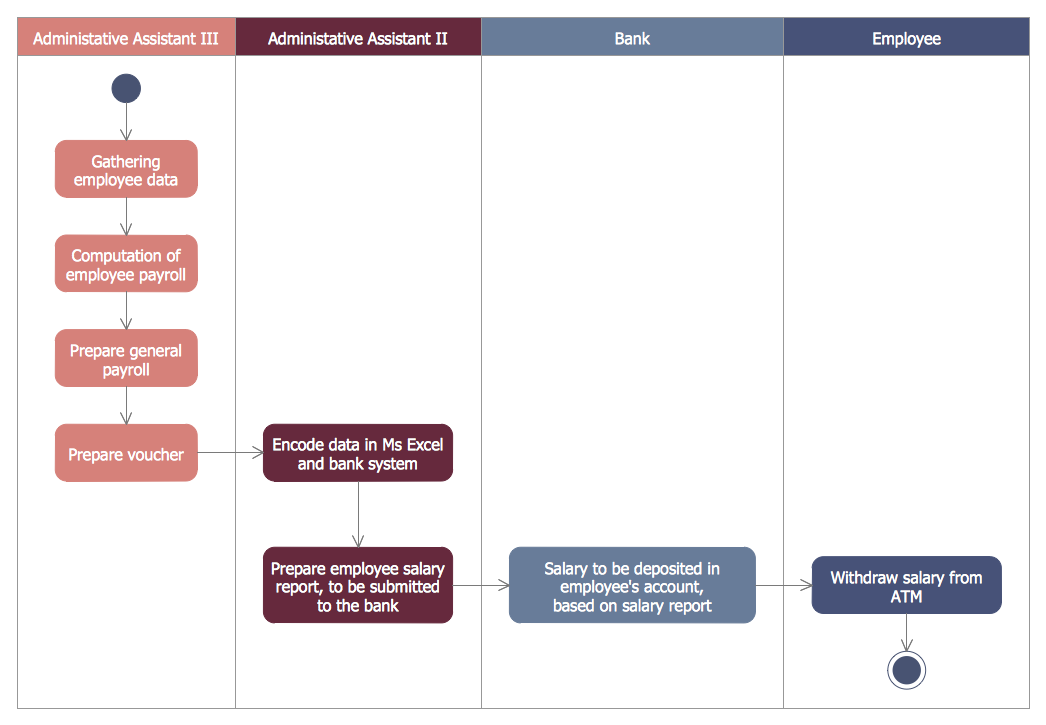
Diagramming Software for Design UML Activity Diagrams

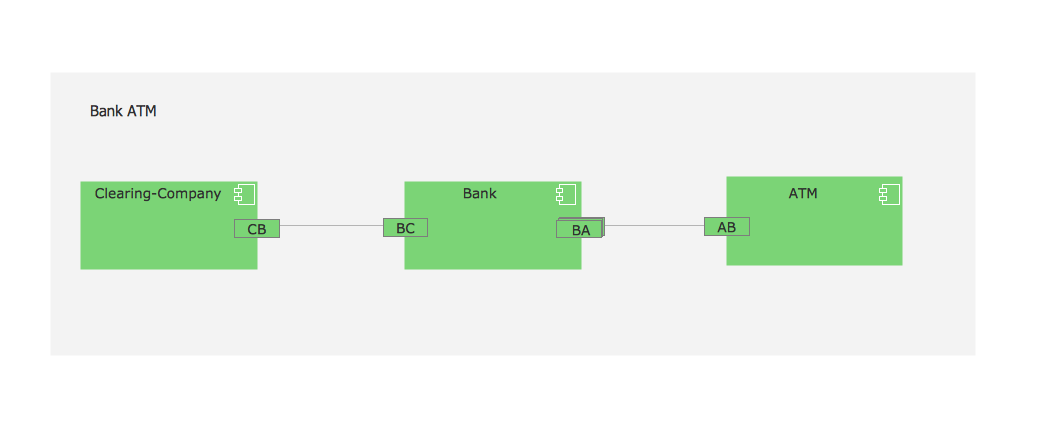
UML Component for Bank
 Entity-Relationship Diagram (ERD)
An Entity-Relationship Diagram (ERD) is a visual presentation of entities and relationships. That type of diagrams is often used in the semi-structured or unstructured data in databases and information systems. At first glance ERD is similar to a flowch
UML Use Case Diagram Example. Registration System

ERD Symbols and Meanings

- Entity-Relationship Diagram ( ERD ) | Er Diagram For Atm System
- Er Diagram For Atm Management System
- Er Diagram For Atm Machine
- Erd Of Atm
- Er Diagram Of Atm Reporting System Project
- Er Diagram For Bank Atm System In Pdf
- Er Diagram And Dfd Diagram Of Atm Machine System
- ATM UML Diagrams | Entity-Relationship Diagram ( ERD ) | Atm Erd ...
- Entity-Relationship Diagram ( ERD ) | Atm Management System ...
- Entity Relationship Simple Diagram For Atm System