Entity Relationship Diagram Symbols
The semantic modeling method nowadays is successfully applied in database structure design. It is effective method of modeling the data structures, which is based on the meaning of these data. As a tool of semantic modeling, there are used different types of Entity-Relationship Diagrams. Entity Relationship Diagram (ERD) is applied to visually and clearly represent a structure of a business database. The main components of ERDs are: entity, relation and attributes. An entity is a class of similar objects in the model, each entity is depicted in the form of rectangle and has the name expressed by a noun. Relation is shown in the form of non-directional line that connects two entities. There are several notation styles used for ERDs: information engineering style, Chen style, Bachman style, Martin Style. The Entity Relationship Diagram symbols used for professional ERD drawing are predesigned by professionals and collected in the libraries of the Entity-Relationship Diagram (ERD) solution for ConceptDraw PRO software.Diagramming Software for Design UML Collaboration Diagrams
ConceptDraw helps you to start designing your own UML Collaboration Diagrams with examples and templates.
Example of DFD for Online Store (Data Flow Diagram) DFD Example
Data Flow Diagram (DFD) is a methodology of graphical structural analysis and information systems design, which describes the sources external in respect to the system, recipients of data, logical functions, data flows and data stores that are accessed. DFDs allow to identify relationships between various system's components and are effectively used in business analysis and information systems analysis. They are useful for system’s high-level details modeling, to show how the input data are transformed to output results via the sequence of functional transformations. For description of DFD diagrams are uses two notations — Yourdon and Gane-Sarson, which differ in syntax. Online Store DFD example illustrates the Data Flow Diagram for online store, the interactions between Customers, Visitors, Sellers, depicts User databases and the flows of Website Information. ConceptDraw PRO enhanced with Data Flow Diagrams solution lets you to draw clear and simple example of DFD for Online Store using special libraries of predesigned DFD symbols.
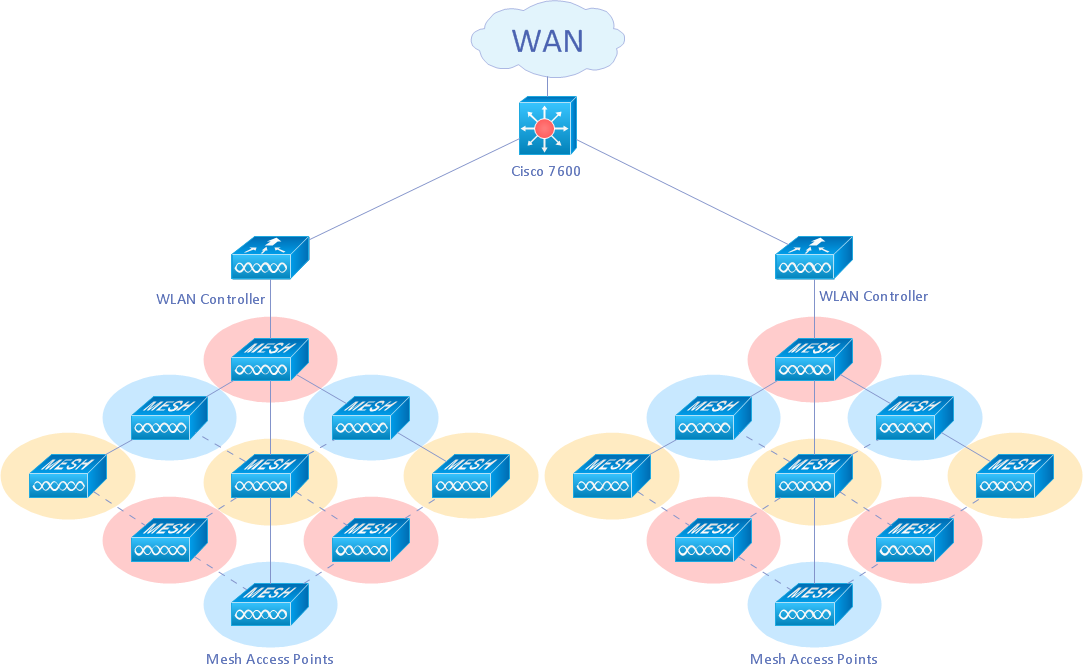
Wireless Network Drawing
The Wireless Network solution helps users to quickly transition from an idea to the implementation of a wireless computer network. ConceptDraw PRO is well placed to provide experienced and comprehensive assistance in the workplace. The vector stencils, examples, and templates included to solution is a strong toolset for network engineer.Diagramming Software for UML Composite Structure Diagrams
UML Composite Structure Diagram shows the internal structure of a class and the possible interactions at this structure.
Wireframe Tools
A wireframe is a scheme of a future web page. Wireframe illustrates the web page structure, location and size of the main elements, as well as their interaction with the user. With such scheme designer defines the functionality of the page, not its appearance.Flowchart Process Example
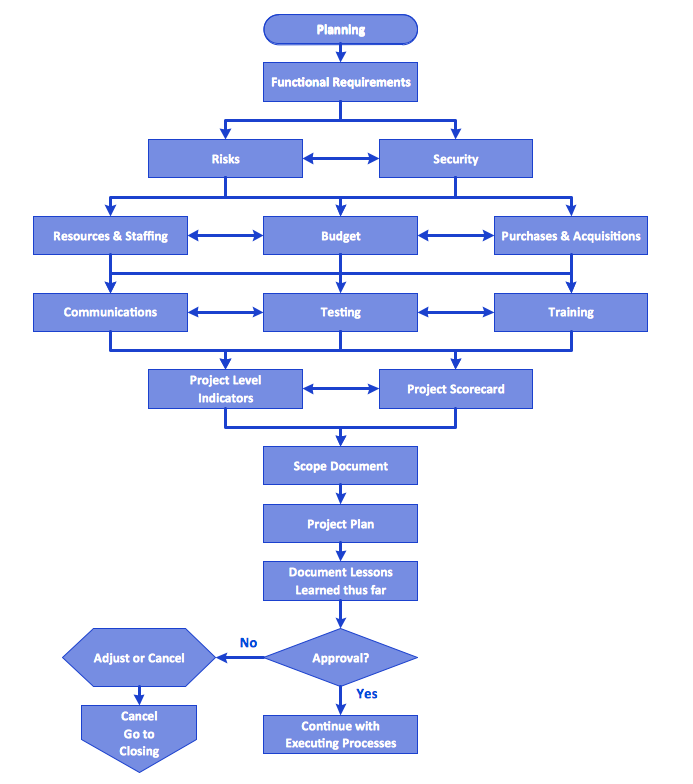
ConceptDraw PRO is a professional software for creating great looking flowcharts. The samples included in this set of software allows users to draw any type of flowchart.Process Flowchart
The main reason of using Process Flowchart or PFD is to show relations between major parts of the system. Process Flowcharts are used in process engineering and chemical industry where there is a requirement of depicting relationships between major components only and not include minor parts. Process Flowcharts for single unit or multiple units differ in their structure and implementation. ConceptDraw PRO is Professional business process mapping software for making Process flowcharts, Process flow diagram, Workflow diagram, flowcharts and technical illustrations for business documents and also comprehensive visio for mac application. Easier define and document basic work and data flows, financial, production and quality management processes to increase efficiency of your business with ConcepDraw PRO. Business process mapping software with Flowchart Maker ConceptDraw PRO includes extensive drawing tools, rich examples and templates, process flowchart symbols and shape libraries, smart connectors that allow you create the flowcharts of complex processes, process flow diagrams, procedures and information exchange. Process Flowchart Solution is project management workflow tools which is part ConceptDraw Project marketing project management software. Drawing charts, diagrams, and network layouts has long been the monopoly of Microsoft Visio, making Mac users to struggle when needing such visio alternative like visio for mac, it requires only to view features, make a minor edit to, or print a diagram or chart. Thankfully to MS Visio alternative like ConceptDraw PRO software, this is cross-platform charting and business process management tool, now visio alternative for making sort of visio diagram is not a problem anymore however many people still name it business process visio tools.
Diagramming Software for Design UML Timing Diagrams
UML Timing Diagram as special form of a sequence diagram are used to explore the behaviors of objects throughout a given period of time.
Flowchart Maker
A flowchart maker is a software showing the interaction, sequence or organization. It also known as flowchart maker or ConceptDraw PRO standard supplied with different types of symbol collections: standard symbols, branded set and authored. It used strictly for enhancing scientific or business documents with abstract explanatory pictures. Business graphic applications show a special knowledge representations and include many features for creating schematic pictures. These graphic tools are known as flowchart maker or flowchart maker software.- Driving Tools Examples Clipart
- Driving Tools Examples
- 7 tools that should be in every home | Example Of Hand Tools And ...
- Five Examples Of Hand Tools Diagram
- Vector stencils library | What Are The Examples Of Hand Tool
- Design elements - ERD (crow's foot notation) | Entity Relationship ...
- Tools - Vector stencils library | 7 tools that should be in every home ...
- 7 tools that should be in every home | Diagram Of Chisel
- Wireframe Examples | Block Diagram | How To Draw an iPhone ...


