This site uses cookies. By continuing to browse the ConceptDraw site you are agreeing to our Use of Site Cookies.

Cause and Effect Diagrams

Cause and Effect Diagrams are designed to identify the potential factors that cause an overall effect. The causes are grouped into the categories, each cause is a source of variation.
ConceptDraw DIAGRAM powerful diagramming and vector drawing software provides the Fishbone Diagrams solution from the Management area of ConceptDraw Solution Park that allows to design the Cause and Effect Diagrams quick, easy and effective.

fishbone diagram, Ishikawa diagram, cause and effect analysis Fishbone Diagram

fishbone diagram, Ishikawa diagram, cause and effect analysis
Fishbone Diagrams solution extends ConceptDraw DIAGRAM software with templates, samples and library of vector stencils for drawing the Ishikawa diagrams for cause and effect analysis.
HelpDesk

How To Create Cause and Effect (Fishbone) Diagram in MS Visio

Cause-and-Effect Ishikawa Diagram is a graphical method of analysis and cause-effect relationships, a tool in the form of fish bone. It is used to systematically determine the cause of the problem and represent it graphically. The technique is primarily used in the framework of quality management for the analysis of quality problems and their causes. Nowadays, it has found worldwide distribution and is used in multiple problem areas. It is one of the tools of lean manufacturing, which is used in group work to find the problems and their causes. ConceptDraw DIAGRAM allows you to easily create Fishbone (Ishikawa) diagram and then make an MS Visio VSDX, or VSD files from your diagrams in a couple clicks, using the export capabilities of ConceptDraw DIAGRAM.

fishbone diagram, Ishikawa diagram, cause and effect analysis Fishbone Diagrams

fishbone diagram, Ishikawa diagram, cause and effect analysis
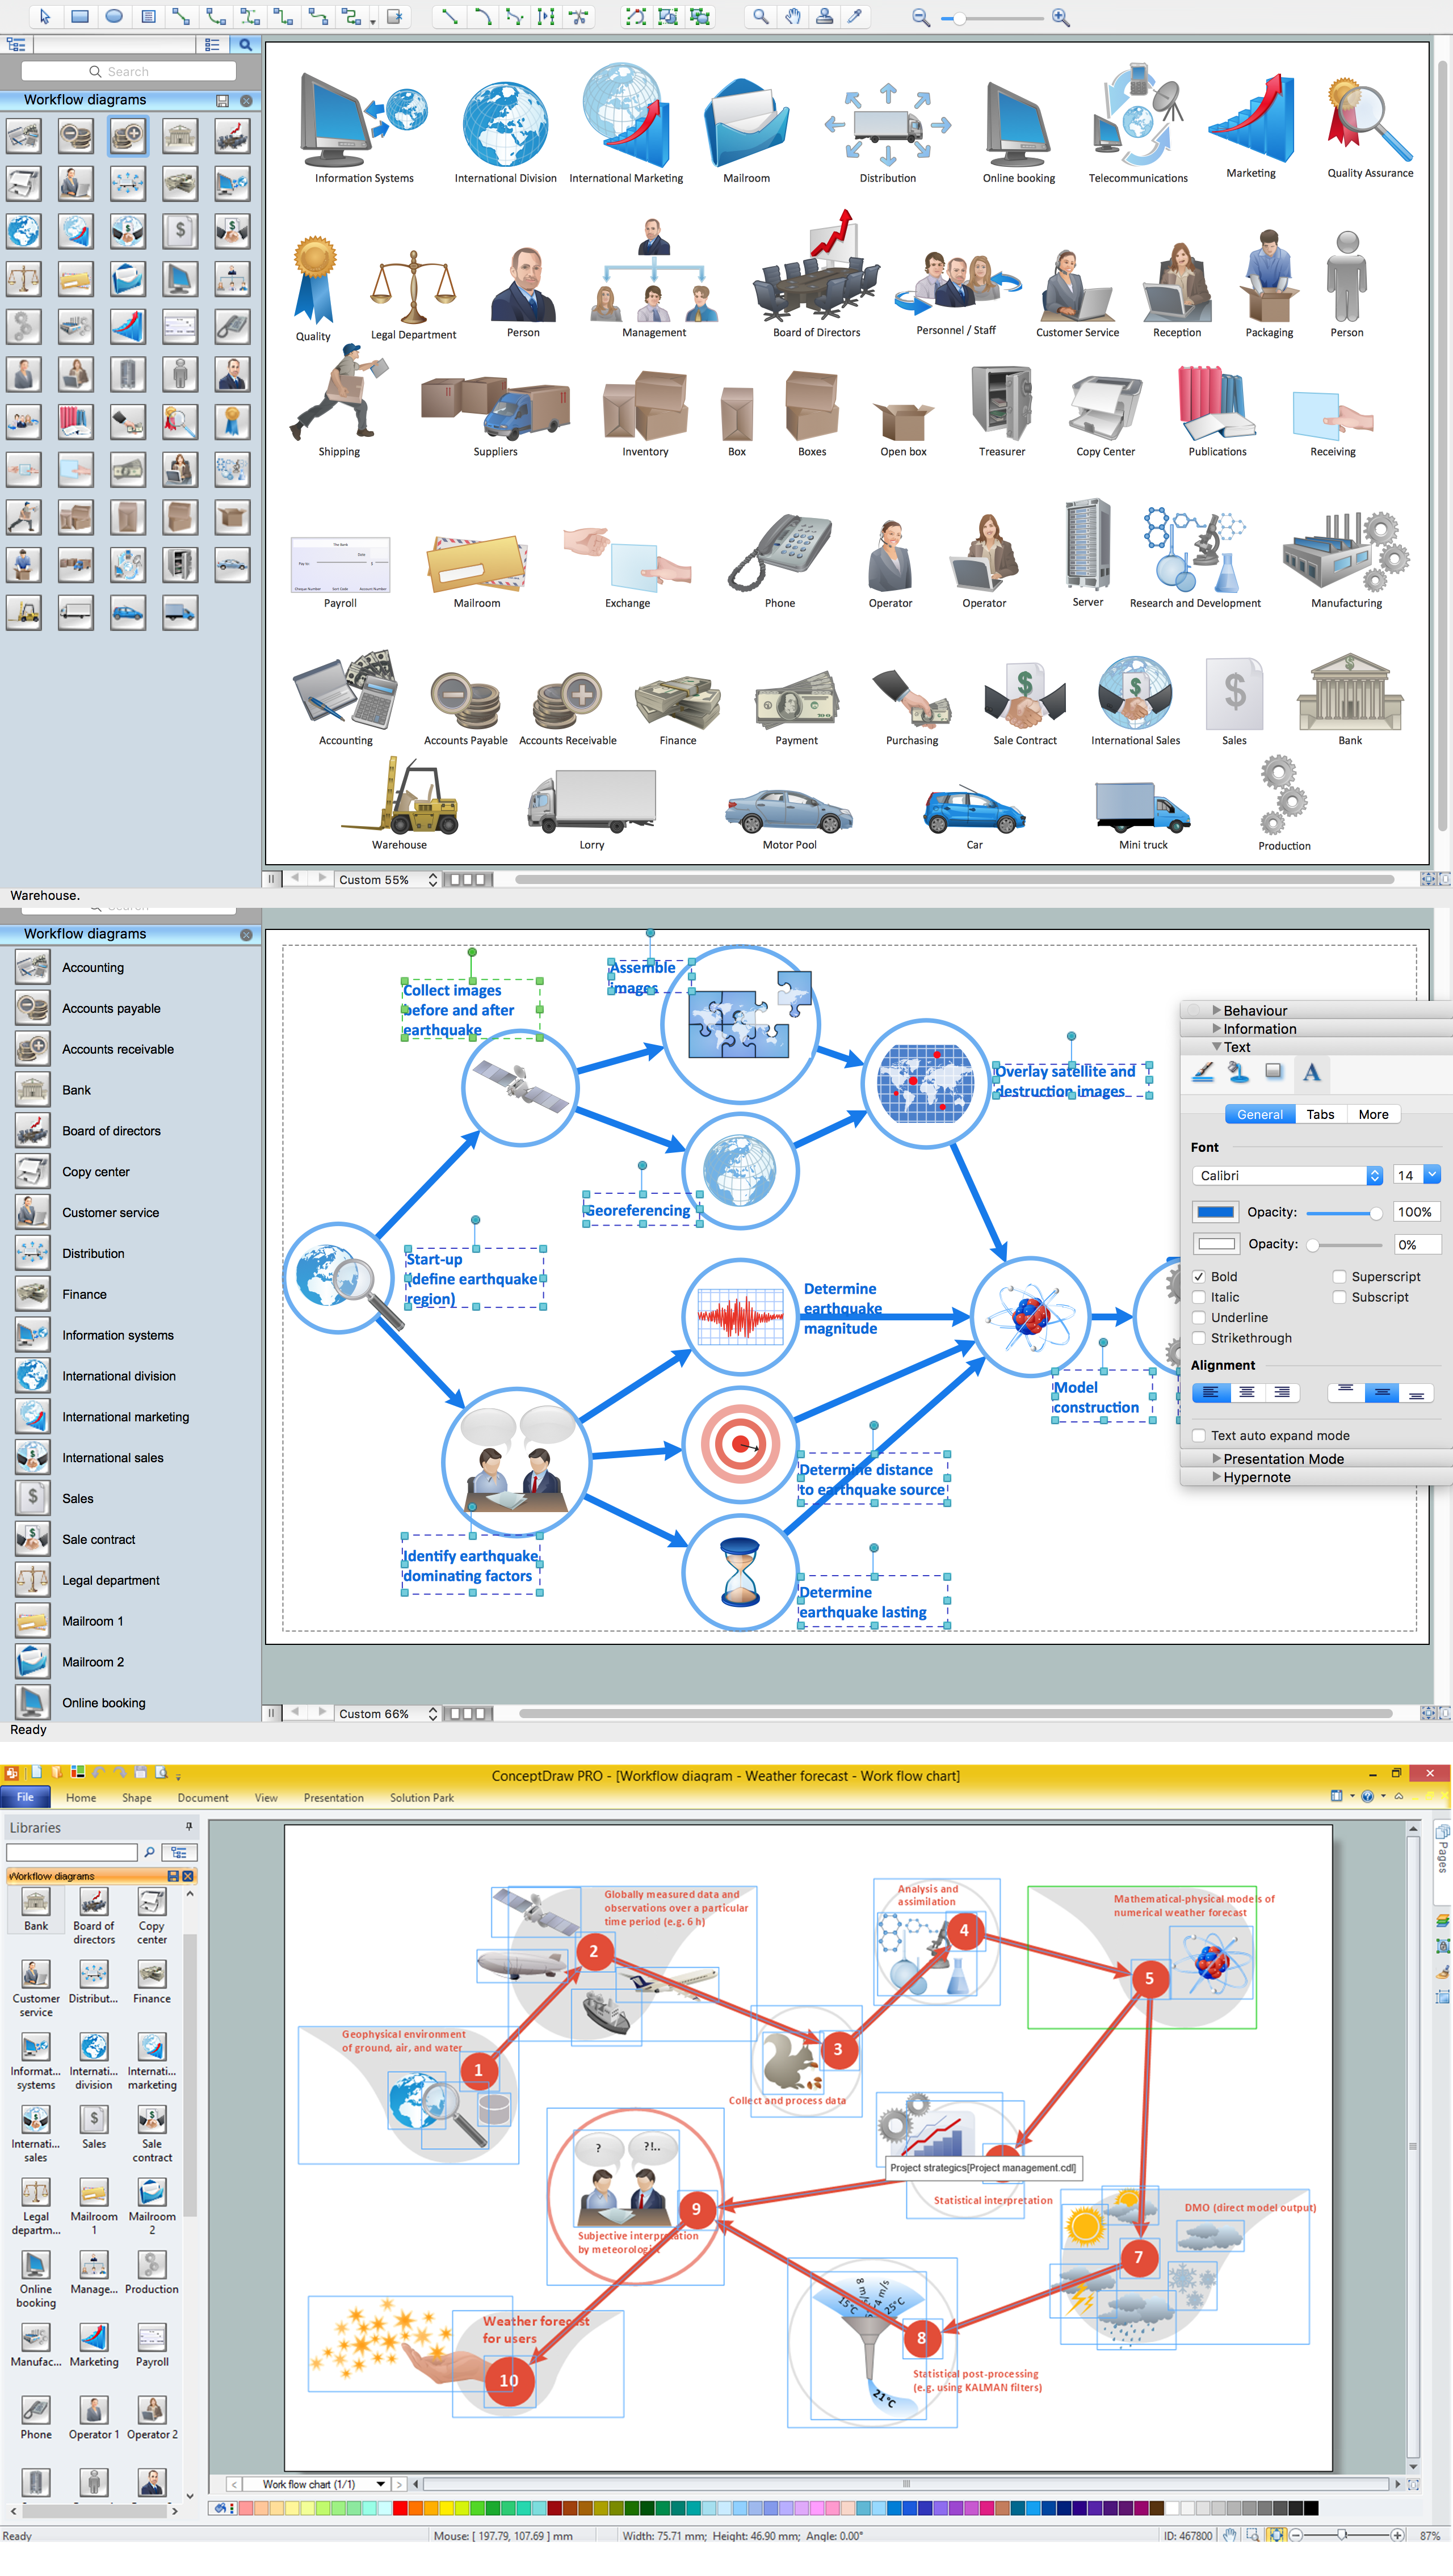
The Fishbone Diagrams solution extends ConceptDraw DIAGRAM software with the ability to easily draw the Fishbone Diagrams (Ishikawa Diagrams) to clearly see the cause and effect analysis and also problem solving. The vector graphic diagrams produced using this solution can be used in whitepapers, presentations, datasheets, posters, and published technical material.
HelpDesk

How to Create a Fishbone (Ishikawa) Diagram Quickly

A Fishbone (Ishikawa) diagram is also called a cause-and-effect diagram. Fishbone diagram is often used in business to determine the cause of some problem. The diagram illustrates the main causes and sub-causes leading to an event. The main goal of the Fishbone diagram is to illustrate in a graphical way the relationship between a given outcome and all the factors that influence this outcome. The complete diagram resembles a fish skeleton as its name implies. The ability to create a Fishbone Diagram is supported by the Fishbone Diagram solution. Use ConceptDraw MINDMAP for structuring data and then ConceptDraw DIAGRAM for generating a Fishbone Diagram from mind map structure.
HelpDesk

How to Draw a Fishbone Diagram

Fishbone (Ishikawa) Diagram is often used in business to determine the cause of some problem. A Fishbone diagram is also called a cause-and-effect diagram. The main goal of the Fishbone diagram is to illustrate in a graphical way the relationship between a given outcome and all the factors that influence this outcome. The complete diagram resembles a fish skeleton as its name implies. Cause and Effect analysis is used in management to identify the possible causes of a problem in order to eliminate them. The ability to create a Fishbone Diagram is supported by the Fishbone Diagram solution.
HelpDesk

How to Add a Fishbone (Ishikawa) Diagram to an MS Word Document

The ability to create a fishbone (Ishikawa) Diagram is supported by the ConceptDraw Fishbone Diagram solution. ConceptDraw DIAGRAM allows you to easily create fishbone diagrams and then insert them into an MS Word document.

ConceptDraw Solution Park ConceptDraw Solution Park

ConceptDraw Solution Park
ConceptDraw Solution Park collects graphic extensions, examples and learning materials

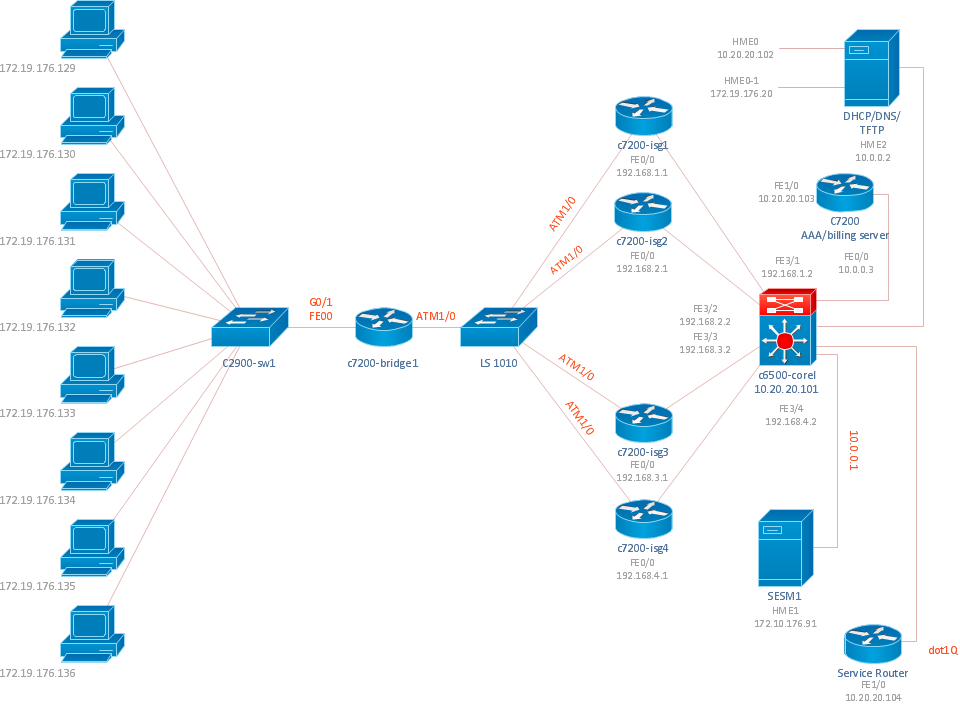
Network Diagram Software

ConceptDraw DIAGRAM is the best network diagram software that allows to draw Logical Network Diagram, Network Communication Plan, Network Floor Plan Layout, Active Directory Diagram, Cisco Network Diagram, LAN and WAN Diagram.

Our network drawing software has numerous network design diagram examples and templates:
GPRS Network Scheme,
GPS Operation Diagram,
Hybrid Network Diagram,
Mobile Satellite Communication Network,
Mobile TV Network Diagram,
Web-based Network Diagram,
Wireless Broadband Network Diagram,
Wireless Router Network Diagram.

You can use the more than 2 000 pre-designed stencils for making custom network diagrams.

Workflow Diagram Examples

ConceptDraw DIAGRAM - workflow software extended with the Workflow Diagram solution provides a complete set of samples, templates and features help you to draw diagrams faster. A workflow software you use for drawing workflow diagrams and business process flow diagrams should provide a wide set of examples allows you get closer with workflow diagrams, learn symbols meaning, find appropriate layout and design, and then start drawing your own workflow diagram masterfully. Workflow diagrams used for orchestrating organizational processes between company departments and humans, so critical process diagrams used to train many people to interact must be clear and professional to convey an idea from a view. Thats a reason we created a lot workflow symbols and workflow icons collected them into special Workflow Diagram solution in ConceptDraw Solution Park.

Fishbone Diagram Template

A causal model is an abstract concept, that describes the causal mechanisms of a system, by noting certain variables and their influence on each other, in an effort to discover the cause of a certain problem or flaw. This model is presented in diagram form by using a fishbone diagram.
ConceptDraw DIAGRAM diagramming and vector drawing software enhanced with Fishbone Diagrams solution helps you create business productivity diagrams from Fishbone diagram templates and examples, that provide to start using of the graphic method for the analysis of problem causes. Each predesigned Fishbone Diagram template is ready to use and useful for instantly drawing your own Fishbone Diagram.

Diagramming Tool Mac

The best Entity Relationship Diagram tool for Mac - ConceptDraw DIAGRAM, extebded with the professional ERD drawing solution. The vector graphic diagrams can be drawn by everybody.