The vector stencils library "Marketing charts" contains 12 graphs and charts: area chart, column chart, divided bar diagram, histogram, horizontal bar graph, line graph, pie chart, ring chart, scatter plot.
Use it to create your marketing infograms.
"A chart can take a large variety of forms, however there are common features that provide the chart with its ability to extract meaning from data.
Typically the data in a chart is represented graphically, since humans are generally able to infer meaning from pictures quicker than from text. Text is generally used only to annotate the data.
One of the more important uses of text in a graph is the title. A graph's title usually appears above the main graphic and provides a succinct description of what the data in the graph refers to.
Dimensions in the data are often displayed on axes. If a horizontal and a vertical axis are used, they are usually referred to as the x-axis and y-axis respectively. Each axis will have a scale, denoted by periodic graduations and usually accompanied by numerical or categorical indications. Each axis will typically also have a label displayed outside or beside it, briefly describing the dimension represented. If the scale is numerical, the label will often be suffixed with the unit of that scale in parentheses. ...
The data of a chart can appear in all manner of formats, and may include individual textual labels describing the datum associated with the indicated position in the chart. The data may appear as dots or shapes, connected or unconnected, and in any combination of colors and patterns. Inferences or points of interest can be overlaid directly on the graph to further aid information extraction.
When the data appearing in a chart contains multiple variables, the chart may include a legend (also known as a key). A legend contains a list of the variables appearing in the chart and an example of their appearance. This information allows the data from each variable to be identified in the chart." [Chart. Wikipedia]
The shapes example "Design elements - Marketing charts" was created using the ConceptDraw PRO diagramming and vector drawing software extended with the Marketing Infographics solition from the area "Business Infographics" in ConceptDraw Solution Park.
Graphs and charts

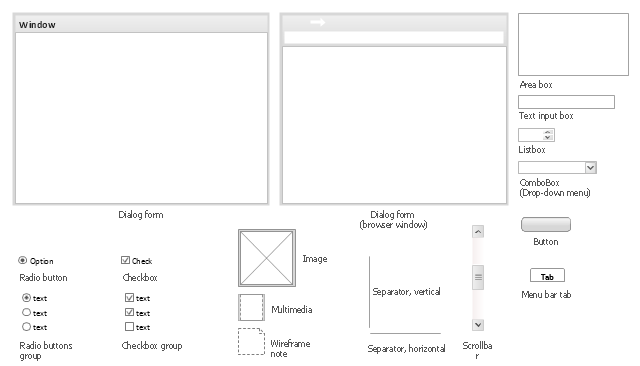
The vector stencils library "Wireframe" contains 18 elements for designing wireframe graphic user interface (GUI) of computer software.
"Wireframes may be utilized by ... designers ... to push the user interface (UI) process. ...
User interface design includes selecting and arranging interface elements to enable users to interact with the functionality of the system. The goal is to facilitate usability and efficiency as much as possible. Common elements found in interface design are action buttons, text fields, check boxes, radio buttons and drop-down menus." [Website wireframe. Wikipedia]
The example "Design elements - Wireframe" was created using the ConceptDraw PRO diagramming and vector drawing software extended with the Graphic User Interface solution from the Software Development area of ConceptDraw Solution Park.
Wireframe graphic user interface design elements
The vector stencils library "Soccer (Football) fields" contains 5 association football pitch templates.
"A football pitch (also known as a football field or soccer field) is the playing surface for the game of football made of turf. Its dimensions and markings are defined by Law 1 of the Laws of the Game, "The Field of Play".
All line markings on the pitch form part of the area which they define. For example, a ball on or above the touchline is still on the field of play; a ball on the line of the goal area is in the goal area; and a foul committed over the 16.5-metre (18-yard) line has occurred in the penalty area. Therefore a ball must completely cross the touchline to be out of play, and a ball must wholly cross the goal line (between the goal posts) before a goal is scored; if any part of the ball is still on or above the line, the ball is still in play." [Association football pitch. Wikipedia]
The example "Design elements - Soccer (Football) fields" was created using the ConceptDraw PRO diagramming and vector drawing software extended with the Soccer solution from the Sport area of ConceptDraw Solution Park.
www.conceptdraw.com/ solution-park/ sport-soccer
Association football pitch templates
-fields.png--diagram-flowchart-example.png)
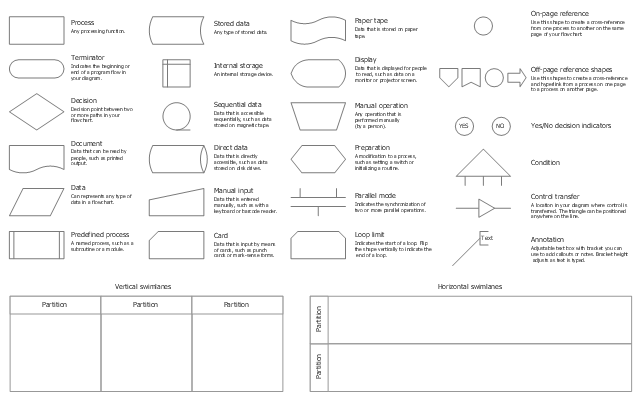
The vector stencils library "Cross-functional flowcharts" contains 31 symbols for creating the deployment flow charts using the ConceptDraw PRO diagramming and vector drawing software.
"A deployment flowchart (sometimes referred to as a "cross functional flowchart") is a business process mapping tool used to articulate the steps and stakeholders of a given process. ...
As deployment flowcharts highlight the relationships between stakeholders in addition to the process flow they are especially useful in highlighting areas of inefficiency, duplication or unnecessary processing. Often utilized within Six sigma activity, completed flowcharts are commonly used to examine the interfaces between “participants” which are typically causes for delays and other associated issues. Deployment flowcharts are useful for determining who within an organization is required to implement a process and are sometimes used as a business planning tool." [Deployment flowchart. Wikipedia]
The example "Design elements - Cross-functional flowcharts" is included in the Cross-Functional Flowcharts solution from the Business Processes area of ConceptDraw Solution Park.
Cross-functional flowchart shapes
- Design elements - Advertisement | User registration form | Vertical ...
- How to Create a Line Chart | Column Chart Software | Design ...
- Design elements - Wireframe
- Design elements - Wireframe | Interface Design | How to Develop ...
- Design elements - Marketing charts | Marketing Organization Chart ...
- Design elements - Wireframe
- Horizontal football field | Football field diagram | Design elements ...
- Soccer (Football) Dimensions | Design elements - Soccer (Football ...
- Wireframe - Vector stencils library | Graphic User Interface | Design ...
- Soccer (Football) Dimensions | Vertical association football pitch ...
- Cross-Functional Flowchart (Swim Lanes) | Swim Lane Diagrams ...
- Marketing Flow Chart | Marketing Organization Chart | Design ...
- Design elements - Marketing charts | Marketing and Sales ...
- Website Wireframe | Wireframe Examples | Wireframing | Wireframe
- Cross-Functional Flowchart | UML State Machine Diagram. Design ...
- Feature Comparison Chart Software | Design elements ...
- Vertical Cross Functional Flowchart | Office - Design Elements ...
- Design elements - Swimlanes BPMN 2.0 | Business Process ...
- Design elements - Football fields | Horizontal colored football field ...
- Design elements - Soccer (Football) fields | Design elements ...