"Ecosystems represent sources of natural capital and provide goods and services to society, also called ecosystem services. The Millennium Ecosystem Assessment identified over 24 ecosystem services that can be divided up into 4 general groups including: 1) provisioning, 2) supporting, 3) regulating and 4) cultural." [User:Sawtoothgirl/ Sustainable Real Estate Development. Wikipedia]
"Humankind benefits in a multitude of ways from ecosystems. Collectively, these benefits are known as ecosystem services. Ecosystem services are regularly involved in the provisioning of clean drinking water and the decomposition of wastes. While scientists and environmentalists have discussed ecosystem services implicitly for decades, these the ecosystem services concept itself was popularized by the Millennium Ecosystem Assessment (MA) in the early 2000s. This grouped ecosystem services into four broad categories: provisioning, such as the production of food and water; regulating, such as the control of climate and disease; supporting, such as nutrient cycles and crop pollination; and cultural, such as spiritual and recreational benefits. To help inform decision-makers, many ecosystem services are being assigned economic values." [Ecosystem services. Wikipedia]
The segmented pyramid diagram example "Ecosystem goods and services" was redesigned using the ConceptDraw PRO diagramming and vector drawing software from Wikimedia Commons file ES_ triangle.png.
[commons.wikimedia.org/ wiki/ File:ES_ triangle.png]
This file is licensed under the Creative Commons Attribution-Share Alike 3.0 Unported license. [creativecommons.org/ licenses/ by-sa/ 3.0/ deed.en]
This segmented pyramid diagram example "Ecosystem goods and services" is included in the Pyramid Diagrams solution from the Marketing area of ConceptDraw Solution Park.
Pyramid diagram

Pyramid Chart Examples

This wheel diagram sample was created on the base of figure illustrating the webpage "Chapter 3: Current State of the Ecosystem" of the website of the National Broadband Plan of US Federal Communications Comission (FCC). "The broadband ecosystem includes applications and content: e-mail, search, news, maps, sales and marketing applications used by businesses, user-generated video and hundreds of thousands of more specialized uses. Ultimately, the value of broadband is realized when it delivers useful applications and content to end-users.
Applications run on devices that attach to the network and allow users to communicate: computers, smartphones, set-top boxes, e-book readers, sensors, private branch exchanges (PBX), local area network routers, modems and an ever-growing list of other devices. New devices mean new opportunities for applications and content.
Finally, broadband networks can take multiple forms: wired or wireless, fixed or mobile, terrestrial or satellite. Different types of networks have different capabilities, benefits and costs.
The value of being connected to the network increases as more people and businesses choose to adopt broadband and use applications and devices that the network supports. Several factors contribute to their decisions. These include whether they can afford a connection, whether they are comfortable with digital technology and whether they believe broadband is useful.
Networks, devices and applications drive each other in a virtuous cycle. If networks are fast, reliable and widely available, companies produce more powerful, more capable devices to connect to those networks. These devices, in turn, encourage innovators and entrepreneurs to develop exciting applications and content. These new applications draw interest among end-users, bring new users online and increase use among those who already subscribe to broadband services. This growth in the broadband ecosystem reinforces the cycle, encouraging service providers to boost the speed, functionality and reach of their networks."
[broadband.gov/ plan/ 3-current-state-of-the-ecosystem/ ]
The circle pie chart example "Forces shaping the broadband ecosystem in the US" was created using the ConceptDraw PRO diagramming and vector drawing software extended with the Target and Circular Diagrams solution from the Marketing area of ConceptDraw Solution Park.
www.conceptdraw.com/ solution-park/ marketing-target-and-circular-diagrams
Wheel diagram

Venn Diagram Examples for Problem Solving. Environmental Social Science. Human Sustainability Confluence

Energy Pyramid Diagram

Diagram of a Pyramid

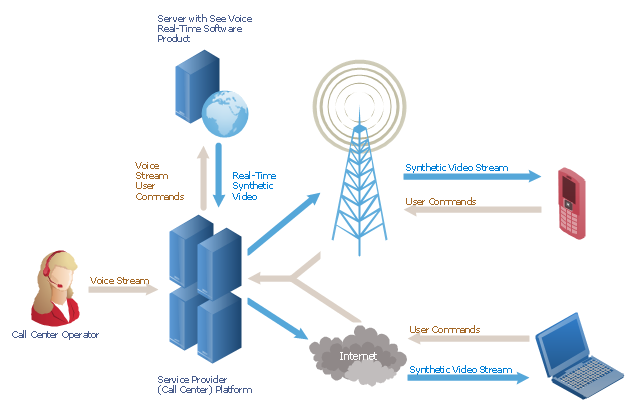
"A call centre or call center is a centralised office used for the purpose of receiving or transmitting a large volume of requests by telephone. An inbound call centre is operated by a company to administer incoming product support or information inquiries from consumers. Outbound call centers are operated for telemarketing, solicitation of charitable or political donations, debt collection and market research. In addition to a call centre, collective handling of letter, fax, live support software,social media and e-mail at one location is known as a contact centre.
A call centre is operated through an extensive open workspace for call centre agents, with work stations that include a computer for each agent, a telephone set or headset connected to a telecom switch, and one or more supervisor stations. It can be independently operated or networked with additional centres, often linked to a corporate computer network, including mainframes, microcomputers and LANs. Increasingly, the voice and data pathways into the centre are linked through a set of new technologies called computer telephony integration (CTI)." [Call centre. Wikipedia]
This call center network diagram example was created using the ConceptDraw PRO diagramming and vector drawing software extended with the Telecommunication Network Diagrams solution from the Computer and Networks area of ConceptDraw Solution Park.
Network scheme
Flowchart Components

Bar Diagrams for Problem Solving. Create event management bar charts with Bar Graphs Solution

This step chart sample shows engineering value chain. It was designed on the base of the Wikimedia Commons file: The engineering value chain.png. "The engineering value chain (EVC) refers to a series of engineering activities and capabilities contributing to value creation encompassing essential elements such as idea generation & selection, design & development, production & delivery, service & support, and disposal & recycling for example." [commons.wikimedia.org/ wiki/ File:The_ engineering_ value_ chain.png]
This file is licensed under the Creative Commons Attribution-Share Alike 3.0 Unported license. [creativecommons.org/ licenses/ by-sa/ 3.0/ deed.en]
The diagram example "Step chart - Value chain" was created using the ConceptDraw PRO diagramming and vector drawing software extended with the Marketing Diagrams solution from the Marketing area of ConceptDraw Solution Park.
Marketing diagram

Geo Map - South America - Nicaragua

 Pyramid Diagrams
Pyramid Diagrams solution extends ConceptDraw DIAGRAM software with templates, samples and library of vector stencils for drawing the marketing pyramid diagrams.
Geo Map - Africa - Madagascar

 Target and Circular Diagrams
This solution extends ConceptDraw DIAGRAM software with samples, templates and library of design elements for drawing the Target and Circular Diagrams.
The vector stencils library "Resources and energy" contains 19 clipart images for drawing illustrations on resources and energy.
"Natural resources occur naturally within environments that exist relatively undisturbed by humanity, in a natural form. A natural resource is often characterized by amounts of biodiversity and geodiversity existent in various ecosystems.
Natural resources are derived from the environment. Some of them are essential for our survival while most are used for satisfying our wants. Natural resources may be further classified in different ways.
Natural resources are materials and components (something that can be used) that can be found within the environment. Every man-made product is composed of natural resources (at its fundamental level). A natural resource may exist as a separate entity such as fresh water, and air, as well as a living organism such as a fish, or it may exist in an alternate form which must be processed to obtain the resource such as metal ores, oil, and most forms of energy." [Natural resource. Wikipedia]
The clip art example "Resources and energy - Vector stencils library" was created in ConceptDraw PRO diagramming and vector drawing software using the Manufacturing and Maintenance solution from the Illustration area of ConceptDraw Solution Park.
Human resources

Batteries

Wind turbine

Transmission tower

Natural gas burner

Solar panel

Lightning

Ionizing radiation hazard sign

High voltage symbol

Atom

Incandescent light bulb

Oil barrels

Power station

Wood

Perpetuum mobile

Hydroelectric dam

Liquefied petroleum gas

Natural gas

Minecart with coal

- Ecosystem goods and services - Segmented pyramid diagram ...
- House tap water supply | Ecosystem goods and services ...
- Healthy Foods | Energy Pyramid Diagram | Ecosystem goods and ...
- Ecosystem goods and services - Segmented pyramid diagram ...
- Ecosystem goods and services - Segmented pyramid diagram | Pie ...
- Energy Pyramid Diagram | Diagram of a Pyramid | Ecosystem goods ...
- Ecology Png
- Pyramid Chart Examples | Pyramid Diagram | Ecosystem goods and ...
- Production Png
- Four Dimensions Bubble Plot | Beauty in nature Illustrations and ...
- Economics Png
- Customer Service Clipart Png
- Pyramid Diagram | Matrices | Ecosystem goods and services ...
- Sustainable Development Examples Png
- Crop Vector Png
- Water Cycle Clipart Png
- Categories Png
- Service-goods continuum diagram | Pyramid Chart Examples ...
- Design elements - Road transport | Ecosystem goods and services ...
- Water cycle diagram | Nature | Ecosystem goods and services ...