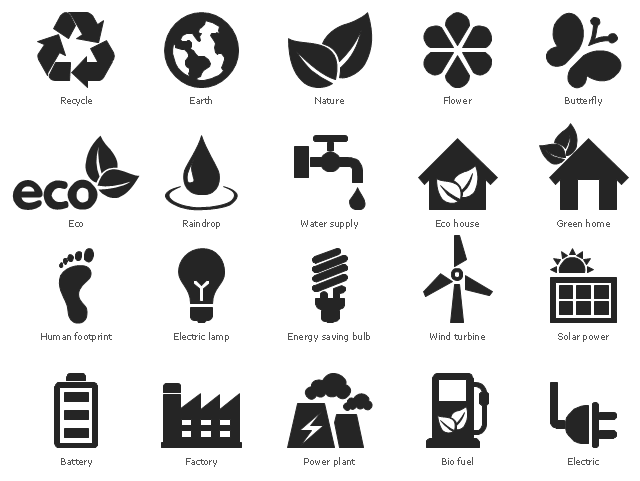
The vector stencils library "Ecology pictograms" contains 20 icons of eco symbols. Use it to draw your ecological infographics. The example "Ecology pictograms - Vector stencils library" was created using the ConceptDraw PRO diagramming and vector drawing software extended with the Pictorial infographics solution from the area "What is infographics" in ConceptDraw Solution Park.
Recycle
Nature

Flower

Butterfly

Earth

Raindrop
Water supply
Eco house

Green home
Electric

Electric lamp
Energy saving bulb
Factory
Power plant
Battery
Bio fuel
Wind turbine
Solar power

Eco
Human footprint

The vector stencils library "Ecology pictograms" contains 20 ecological pictograms.
Use it to draw your eco illustrations, presentations, web pages and infographics.
The example "Design elements - Ecology pictograms" was created using the ConceptDraw PRO diagramming and vector drawing software extended with the Pictorial Infographic solution from the area "What is infographics" in ConceptDraw Solution Park.
Eco pictograms
Design Pictorial Infographics. Design Infographics

How to Draw Pictorial Chart. How to Use Infograms

Pictorial Chart

Infographic Maker

How To Create a Bubble Chart

Scatter Chart Examples

- Vector Vegetation Black Png
- Factory Vector Png Black
- How to Draw a Computer Network Diagrams | Ecology pictograms ...
- Ecology pictograms - Vector stencils library | Ecology pictograms ...
- Ecology pictograms - Vector stencils library | Ecology pictograms ...
- Ecology pictograms - Vector stencils library | Ecology pictograms ...
- House tap water supply | Ecology pictograms - Vector stencils library ...
- Ecology pictograms - Vector stencils library | Ecology pictograms ...
- Ecology pictograms - Vector stencils library | Ecology pictograms ...
- Ecology pictograms - Vector stencils library | Ecology pictograms ...
- Ecology pictograms | Eco Icon Png
- Design elements - Ecology pictograms
- Renewable energy | Ecology pictograms - Vector stencils library ...
- Ecology pictograms - Vector stencils library | Design elements ...
- Design elements - Ecology pictograms
- Water Vector Icon Png
- Bulb Infographics Png
- Wind Png Icons
- Solar Vector Png
- Electric Bulb Vector Png