This site uses cookies. By continuing to browse the ConceptDraw site you are agreeing to our Use of Site Cookies.

Cylinder Venn Diagram

You need design Cylinder Venn Diagram? Nothing could be easier with ConceptDraw DIAGRAM diagramming and vector drawing software extended with Venn Diagrams Solution from the “Diagrams” Area. ConceptDraw DIAGRAM allows you to design various Venn Diagrams including Cylinder Venn Diagrams.

Venn Diagram Maker

ConceptDraw DIAGRAM diagramming and vector drawing software extended with Venn Diagrams solution from the "Diagrams" area of ConceptDraw Solution Park is a powerful Venn Diagram maker. Create fast and easy your own Venn Diagrams to visualize: all the possible logical relations between sets, simple set relationships in logic, statistics, mathematics, sociology, marketing, summarize the status and future viability of a project.

Simple Diagramming

Create flowcharts, org charts, floor plans, business diagrams and more with ConceptDraw DIAGRAM.

Venn Diagram Examples for Problem Solving. Venn Diagram as a Truth Table

Venn diagrams are illustrations used in the branch of mathematics known as set theory. They show the mathematical or logical relationship between different groups of things (sets). A Venn diagram shows all the possible logical relations between the sets.

3 Circle Venn. Venn Diagram Example

This example shows the 3 Circle Venn Diagram. The Venn Diagrams visualize all possible logical intersections between several sets. On this example you can see the intersections of 3 sets. Venn Diagrams are widely used in mathematics, logic, statistics, marketing, sociology, etc.

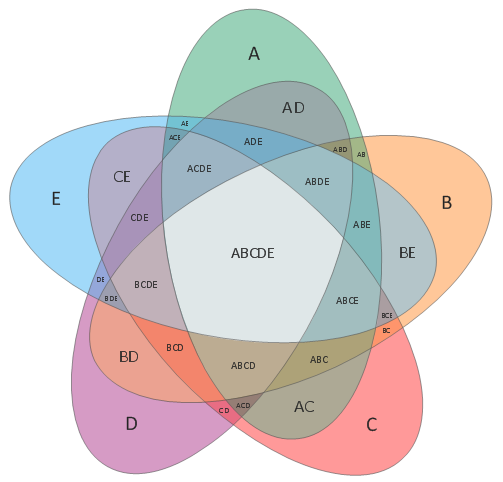
Multi Layer Venn Diagram. Venn Diagram Example

To visualize the relationships between subsets of the universal set you can use Venn diagrams. To construct one, you should divide the plane into a number of cells using n figures. Each figure in the chart represents a single set of, and n is the number of represented sets. Splitting is done in a way that there is one and only one cell for any set of these figures, the points of which belong to all the figures from the set and do not belong to others. The plane on which the figures are represented, is the universal set U. Thus, the point which does not belong to any of the figures, belongs only to U.

Venn Diagram

Venn diagrams are illustrations used in the branch of mathematics known as set theory. They show the mathematical or logical relationship between different groups of things (sets). A Venn diagram shows all the possible logical relations between the sets.

Venn Diagram Template

It's impossible to overestimate the usefulness and convenience of using the ready templates when you create your own diagrams and charts. And Venn Diagrams are not exception. ConceptDraw DIAGRAM diagramming and vector drawing software presents the Venn Diagrams solution from "Diagrams" area which offers a set of Venn Diagram templates and samples. Use the suitable Venn Diagram Template to create your own Venn Diagram of any complexity.

3 Circle Venn Diagram. Venn Diagram Example

This template shows the Venn Diagram. It was created in ConceptDraw DIAGRAM diagramming and vector drawing software using the ready-to-use objects from the Venn Diagrams Solution from the "Diagrams" area of ConceptDraw Solution Park.
Venn Diagrams visualize all possible logical intersections between several sets and are widely used in mathematics, logic, statistics, marketing, sociology, etc.

Venn Diagram Examples for Problem Solving. Environmental Social Science. Human Sustainability Confluence

The Venn diagram example below shows sustainable development at the confluence of three constituent parts.
Create your Venn diagrams for problem solving in environmental social science using the ConceptDraw DIAGRAM diagramming and vector drawing software extended with the Venn Diagrams solution from the area "Diagrams" of ConceptDraw Solution Park.

Venn Diagram Template for Word

This template shows the Venn Diagram. It was created in ConceptDraw DIAGRAM diagramming and vector drawing software using the ready-to-use objects from the Venn Diagrams Solution from the "Diagrams" area of ConceptDraw Solution Park.

Visual Presentations Made Easy with Diagramming Software

Automatically create a presentation-quality diagram in one click with ConceptDraw DIAGRAM.

Circles Venn Diagram

This example shows the 4 Circle Venn Diagram. The Venn Diagram visualizes all possible logical relations between several sets. The sets are represented as circles on the Venn Diagram. On this example you can see the intersections of 4 sets. Venn Diagrams are widely used in mathematics, logic, statistics, marketing, sociology, etc.

Basic Diagramming

ConceptDraw DIAGRAM with the specific tools you need to easily draw flowcharts, block diagrams, bar charts, histograms, pie charts, divided bar diagrams, line graphs, area charts, scatter plots, circular arrows diagrams, Venn diagrams, bubble diagrams, concept maps, electrical circuit diagrams, schematics,and others.
Use Basic Diagramming solution to draw you own diagrams, charts and graphs for graphic communication, explanation of business and personal ideas and concepts, simple visual presentation of numerical data, complex structures, logical relations, step-by-step flows of actions or operations.