 ConceptDraw Solution Park
ConceptDraw Solution Park collects graphic extensions, examples and learning materials
HelpDesk
How to Create Management Infographics Using ConceptDraw PRO

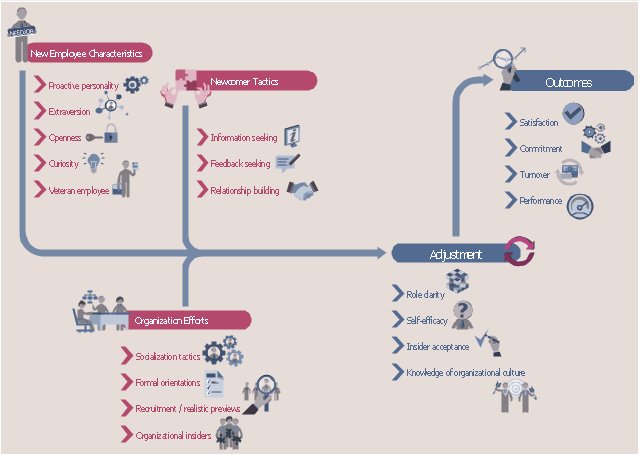
HR infographics "Onboarding model" was redesigned from the Wikimedia Commons file: Organizationalsocializationmodel.jpg. [commons.wikimedia.org/ wiki/ File:Organizationalsocializationmodel.jpg]
This file is licensed under the Creative Commons Attribution-Share Alike 3.0 Unported license. [creativecommons.org/ licenses/ by-sa/ 3.0/ ]
"Onboarding, also known as organizational socialization, refers to the mechanism through which new employees acquire the necessary knowledge, skills, and behaviors to become effective organizational members and insiders. Tactics used in this process include formal meetings, lectures, videos, printed materials, or computer-based orientations to introduce newcomers to their new jobs and organizations. Research has demonstrated that these socialization techniques lead to positive outcomes for new employees such as higher job satisfaction, better job performance, greater organizational commitment, and reduction in occupational stress and intent to quit. These outcomes are particularly important to an organization looking to retain a competitive advantage in an increasingly mobile and globalized workforce." [Onboarding. Wikipedia]
The HR infographics example "Onboarding model" was created using the ConceptDraw PRO diagramming and vector drawing software extended with the HR Flowcharts solution from the Management area of ConceptDraw Solution Park.
HR Infographics
 Data Flow Diagrams (DFD)
Data Flow Diagrams solution extends ConceptDraw PRO software with templates, samples and libraries of vector stencils for drawing the data flow diagrams (DFD).
The vector stencils library "Management pictograms" contains 72 management pictograms.
Use it to create your management infogram in the ConceptDraw PRO diagramming and vector drawing software.
The flat icons example "Management pictograms - Vector stencils library" is included in the solution "Marketing infographics" from the "Business infographics" area of ConceptDraw Solution Park.
Use it to create your management infogram in the ConceptDraw PRO diagramming and vector drawing software.
The flat icons example "Management pictograms - Vector stencils library" is included in the solution "Marketing infographics" from the "Business infographics" area of ConceptDraw Solution Park.
Accounting management

Activity

Audit management

Board of directors

Budget

Business managemen

Business management tools

Business model

Commanding

Communication

Company

Contract management

Controlling

Coordinating

Core competencies

Corporate strategy

Creativity

Crisis management

Crisis management 2

Decision making

Environmental management

Expenses

External environment

Financial management

Financial management 2

Financial planning

First-level manager

Goal

HR management

Investment management

IT management

Knowledge management

Knowledge management 2

Leadership

Macro environment

Management system

Managerial accounting

Manufacturing management

Market orientation

Marketing management

Marketing strategy

Middle-level manager

Mission

Objectives

Operations management

Organizing

Performance

Performance management

Planning

Policy

PR management

Problem solving

Process management

Product management

Profit

Profit 2

Project management

Quality management

Research and development

Resource management

Resources

Risk management

Sales manegment

Service management

Stakeholder management

Strategic management

Strategic planning

Technology management

Time frame

Time management

Top-level manager

Vision

 Entity-Relationship Diagram (ERD)
Entity-Relationship Diagram (ERD) solution extends ConceptDraw PRO software with templates, samples and libraries of vector stencils from drawing the ER-diagrams by Chen's and crow’s foot notations.
 Event-driven Process Chain Diagrams
Event-driven Process Chain (EPC) Diagram is a type of flowchart widely used for modeling in business engineering and reengineering, business process improvement, and analysis. EPC method was developed within the Architecture of Integrated Information Systems (ARIS) framework.
HelpDesk
How to Create an IDEF0 Diagram for an Application Development

HelpDesk
How to Draw a Pictorial Chart in ConceptDraw PRO

HelpDesk
How To Make a PowerPoint Presentation of a Business Process Model Using ConceptDraw PRO

 IDEF0 Diagrams
IDEF0 Diagrams visualize system models using the Integration Definition for Function Modeling (IDEF) methodology. Use them for analysis, development and integration of information and software systems, and business process modelling.
 Enterprise Architecture Diagrams
Enterprise Architecture Diagrams solution extends ConceptDraw PRO software with templates, samples and library of vector stencils for drawing the diagrams of enterprise architecture models.
HelpDesk
How to Create an Enterprise Architecture Diagram in ConceptDraw PRO

- Flowchart - HR management process
- Management Drawing Software Hiring Hr Steps Symbols
- Management Drawing Software Recruitment Hr Steps Symbols
- How to Create a HR Process Flowchart Using ConceptDraw PRO ...
- HR Flowcharts | HR Flowchart Symbols | HR Management Software ...
- HR Flowcharts | HR Flowchart Symbols | Human Resource ...
- How to Draw a Good Diagram of a Business Workflow ...
- Human Resource Development | Human Resources | Human ...
- Six Markets Model Chart | How to Draw a Good Diagram of a ...
- HR Management Software | Human Resource Management ...
- HR management process - Flowchart | Types of Flowchart ...
- HR Flowcharts | How to Create a HR Process Flowchart Using ...
- Human Resource Development | Process Flowchart | Basic ...
- Human Resources | Human Resource Development | Human ...
- HR management process - Flowchart | HR Flowcharts | How to ...
- Management Drawing Software Hr Steps Symbols
- Management Information System Block Diagram
- Types of Flowchart - Overview | HR management process ...
- Human Resource Development | HR Flowcharts | Basic Flowchart ...
- 5 level pyramid model diagram of information systems types ...