This site uses cookies. By continuing to browse the ConceptDraw site you are agreeing to our Use of Site Cookies.

Soccer (Football) Formation

Using diagrams is the easiest way to explain the soccer formations. The Soccer solution from the Sport area of ConceptDraw Solution Park is designed as a tool that helps you produce the soccer diagrams in a few minutes. The predesigned samples of the Soccer solution for ConceptDraw PRO depict the most popular formation diagrams.

Soccer (Football) Positions

Explaining soccer positions becomes much more easier and time saving with visual drawings. ConceptDraw PRO software extended with the Soccer solution from the Sport area of ConceptDraw Solution Park is very useful tool that will help you design the soccer-related drawings of any complexity in minutes.

Soccer (Football) Tactics

To quick and easy draw the diagrams with soccer (football) tactics, use the "Soccer (Football) Fields" and "Soccer (Football) Positions" libraries from the Soccer solution from the Sport area of ConceptDraw Solution Park

Soccer (Football) Offside

It’s very convenient to explain the different tactics and positions using the visual drawings. ConceptDraw PRO software extended with the Soccer solution from the Sport area of ConceptDraw Solution Park provides libraries, templates and samples allowing specialists or soccer fans to draw the soccer-related diagrams and schemas of any complexity in a few minutes.

Basketball Court Diagram and Basketball Positions

ConceptDraw PRO software extended with the Basketball solution from the Sport area of ConceptDraw Solution Park provides libraries, templates and samples allowing basketball specialists and fans to draw the professional looking diagrams and schemas of any complexity in a few minutes. It’s very convenient way to explain the different basketball tactics, positions and rules using the visual illustrations.

Basketball Plays Software

Basketball is a popular sport played by two teams of five players with a ball. The game takes place on a rectangular court. The team goal is to score a ball into the basket of the opponent team. The team with the most points wins the game.
ConceptDraw PRO diagramming and vector drawing software extended with Basketball solution from the Sport area of ConceptDraw Solution Park is a very useful tool for designing the basketball-related diagrams of any complexity.
HelpDesk

How to Draw the Different Types of Pie Charts

Using the Pie Chart, you can visually estimate the relative contribution that different data categories contribute to a whole value. The pie chart displays the statistics in a visual format. The main use of pie charts to show comparisons. The larger piece of the pie, the more the value of this value compared to the rest. Various applications of pie charts can be found in business and education. For business, pie charts can be used to compare the success or failure of the goods or services. They may also be used to display the business market share.

computer networks Computer and Networks Area

computer networks
The solutions from Computer and Networks Area of ConceptDraw Solution Park collect samples, templates and vector stencils libraries for drawing computer and network diagrams, schemes and technical drawings.
HelpDesk

How to Create a Bar Chart in ConceptDraw PRO

Bar charts (bar graphs) are diagrams displaying data as horizontal or vertical bars of certain heights.
Bar charts are widely used to show and compare the values of the same parameters for different data groups.
The bar graph can be vertical or horizontal. This depends on the amount of categories. There are many methods in which bar graph can be built and this makes it a very often used chart type. Usually, a bar chart is created so that the bars are placed vertically. Such arrangement means that the bar's height value is proportional to the category value. Nevertheless, a bar chart can be also drawn horizontally. This means that the longer the bar, the bigger the category. Thus, a bar chart is a good way to present the relative values of different measured items. The ConceptDraw Bar Graphs solution allows you to draw a bar chart quickly using a vector library, containing the set of various bar charts objects.
HelpDesk

How to Add Text to a Connector in ConceptDraw PRO

The new ConceptDraw Arrows10 Technology is a powerful diagramming technique that powered the way business drawing created. ConceptDraw PRO gives you some tools for connecting shapes: Direct Connectors, Smart, Arc, Bezier, Curve and Round Connectors.Direct Connectors are direct lines from the point to the point. Smart , Arc, Bezier, Curve and Round Connectors are almost the same as Direct Connectors. However, they automatically move around other objects. You can use Chain, or Tree connection mode for connection of multiple objects with any type of connectors. ConceptDraw PRO allows you to add and move text on a connector the same way that you add and move text on other any object.
HelpDesk

How to Draw a Line Chart Quickly

A common line chart is a graphical representation of the functional relationship between two series of data. A line chart that is created by connecting a series of data points together with a straight line is the most basic type of a line chart. A line chart can be used for depicting data that changes continuously over time. It is extensively utilized in statistics, marketing and financial business. ConceptDraw Line Graph solution provides the possibility to make 2D line charts quickly and effortlessly.

football, american football, football field, american football field, football field dimensions, offense, defense, football plays, football diagram Football

football, american football, football field, american football field, football field dimensions, offense, defense, football plays, football diagram
The Football Solution extends ConceptDraw PRO v9.5 (or later) software with samples, templates, and libraries of vector objects for drawing football (American) diagrams, plays schemas, and illustrations. It can be used to make professional looking documen
HelpDesk

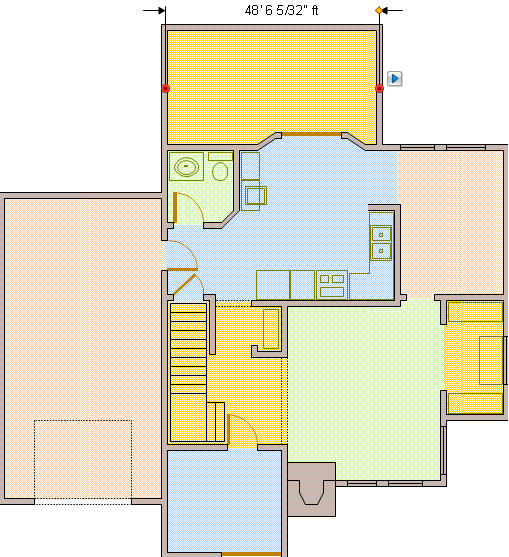
How to Create a Floor Plan Using ConceptDraw PRO

Making a floor plan is the best way to get a handle on how to organize your living space, and find out what could be changed. Creating a floor plan to scale is a challenge of the home and interior design process and can be noticeably helpful for visualizing things like furniture layout. You can use ConceptDraw PRO to produce layouts of real estate properties. ConceptDraw PRO contains the large quantity of pre-designed vector objects that you can use for quick and easy designing such floor plans. You  can easily determine the size of the rooms and distances in you drawing. The ability to create a floor plan is delivered by the Floor Plans solution. This solution extends ConceptDraw PRO with libraries that contains over 500 objects of floor plan elements. There is a set of special objects that displays the sizes, corners, squares and other technical details using the current measurements of units.
HelpDesk

How to Draw a Mind Map on PC Using ConceptDraw MINDMAP

Mind maps are useful forcapturing ideas, organizing and structuring information in a visual form, that is easier to understand, and easier to explain to others. Mind map consists of a general Main Idea surrounded by other related topics and subtopics, which are displayed in a radial hierarchical structure. Read this step-by-step guide on how to create a mind map using ConceptDraw MINDMAP for Windows.
HelpDesk

How to Draw a Histogram in ConceptDraw PRO

Histogram is a diagram used to visualize data through bars of variable heights. Making histogram can be helpful if you need to show data covering various periods (hours, days, weeks, etc). When the vertical column of the histogram refer to frequency it shows how many times any event happens. It is a Frequency histogram. A bar chart diagram is similar to a histogram, but in contrast to a bar chart a histogram represents the number how many times there have been certain data values. You can use a histogram to depict continual data flow such as temperature, time, etc. You can effortlessly draw histograms using the Histograms solution for CnceptDraw PRO. Making a histogram can by very useful to represent various statistical data.
HelpDesk

How to Design a Fast-Food Restaurant Menu Using ConceptDraw PRO

Food menus are a crucial part in catering business. When designing your menu for a fast-food restaurant, you want to create a list of meals that which looks professional and attractive. Just the image of a food, will get guests a pleasant expectation. Adds use the best images to present tempting dishes. Restaurants and fast-food joints add images of their best dishes to the menu — even if what you see isn't always exactly what you get!
The ConceptDraw Food Court solution provides users with collection of library objects and example drawings for ConceptDraw PRO makes short work of drawing professional visualizations related to catering business.
HelpDesk

How to Create Infographics that Help People Eat Healthy

The most effective manner of presenting information on healthy diet and food nutrition is using various visualizations such as charts or infographics. To help easily create infographics and diagrams of healthy eating, ConceptDraw has provided the Health Food solution to its Solution Park. It contains vector stencil libraries of healthy eating options, samples of diagrams and infographics, and a set of templates to help you create your own diagrams, infographics and even adds. Using ConceptDraw PRO you can easily create and share healthy food recipes and materials about the proper nutrition.

Basketball Defense Drills

The Basketball solution for ConceptDraw PRO includes a wide collection of templates and samples to help you draw any basketball-related diagrams and schemas as quickly as possible. All templates are ready-to-modify. You can start from any of them, change positions, add vector clipart from the libraries, text and thus get ready diagram in some clicks.
HelpDesk

How to Create a Typography Infographic Using ConceptDraw PRO

Infographics are a good way to visually share knowledge , to communicate information and illustrate a message. Typography Infographics can help to present at a glance a large pack of complex information in a clear and vivid manner. Designers use the elements of typography Infographics to compose a graphic presentation of an information that is intended to depict the information behind the numbers in a creative and interesting visual way. Each infographic element is used to depict and explain an idea of the current portion of information. Each infographic element must inform its message clearly. ConceptDraw PRO provides the ability to design different kinds of typography infographics. You can use ConceptDraw Typography Infographics solution to create typography infographics effortlessly and quickly using the special set of vector stencils libraries.

draw histogram, histogram Histograms

draw histogram, histogram
How to make a Histogram? Making a Histogram is an incredibly easy process when it is done with ConceptDraw PRO. The Histograms Solution enhances ConceptDraw PRO v10 functionality with extensive drawing tools, numerous samples, and examples; also a quick-start template and library of ready vector stencils for visualization the data and professional drawing Histograms.