This site uses cookies. By continuing to browse the ConceptDraw site you are agreeing to our Use of Site Cookies.

Ice Hockey Rink Dimensions

Meeting ice hockey rules one should learn ice hockey rink terms, lines, zones etc. ConceptDraw DIAGRAM is an advanced drawing software that allows you produce ice hockey rink depiction of any complexity, from simple sketch drawing to detailed one as on example below.

Mechanical Drawing Symbols

Mechanical Engineering solution — 8 libraries are available with 602 commonly used mechanical drawing symbols in Mechanical Engineering Solution, including libraries called Bearings with 59 elements of roller and ball bearings, shafts, gears, hooks, springs, spindles and keys; Dimensioning and Tolerancing with 45 elements; Fluid Power Equipment containing 113 elements of motors, pumps, air compressors, meters, cylinders, actuators and gauges; Fluid Power Valves containing 93 elements of pneumatic and hydraulic valves (directional control valves, flow control valves, pressure control valves) and electrohydraulic and electropneumatic valves; as well as many other sophisticated symbols and templates for your use.

UML Class Diagram Generalization Example UML Diagrams

This sample was created in ConceptDraw DIAGRAM diagramming and vector drawing software using the UML Class Diagram library of the Rapid UML Solution from the Software Development area of ConceptDraw Solution Park.
This sample describes the use of the classes, the generalization associations between them, the multiplicity of associations and constraints. Provided UML diagram is one of the examples set that are part of Rapid UML solution.

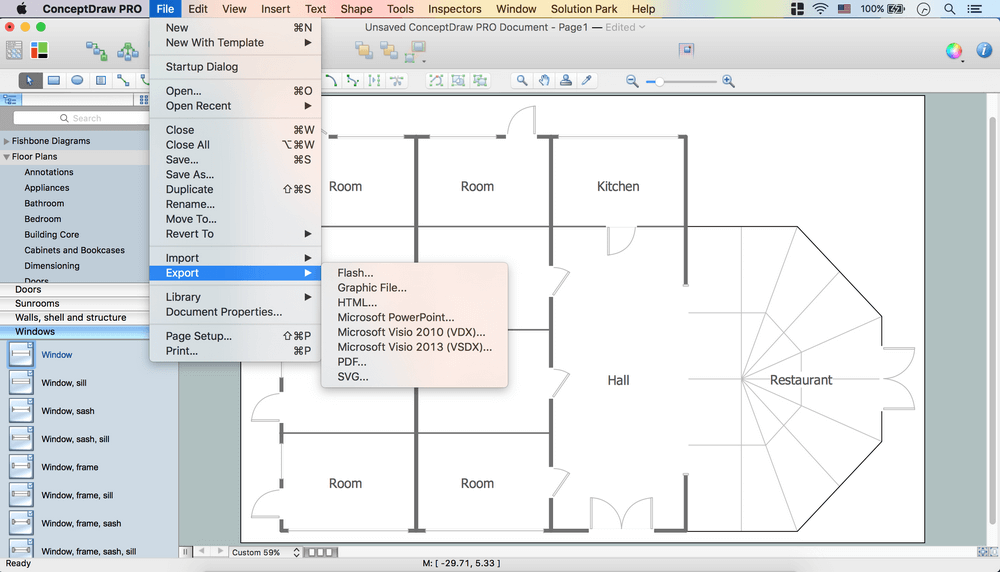
Create Floor Plans Easily with ConceptDraw DIAGRAM

There are two basic ways of creating a floor plan: hiring an interior designer or designing on one’s own. Professional help can be quite expensive, and the result may not always be worth the money. Let’s take a look at what skills are needed to create the interior design on your own.
Primarily, this basic knowledge of the composition rules. It helps to compose, to place the shapes and volume of the interior, to achieve balance in the room between the free space and objects. This might help to compose correctly, to place the shapes and the volumes in the interior, to achieve balance between free space and furniture in the room.
Basic color theory. There are strictly defined rules and laws, which are used to select a fitting color combinations to create a harmonious interior.
How to Draw a Floor Plan
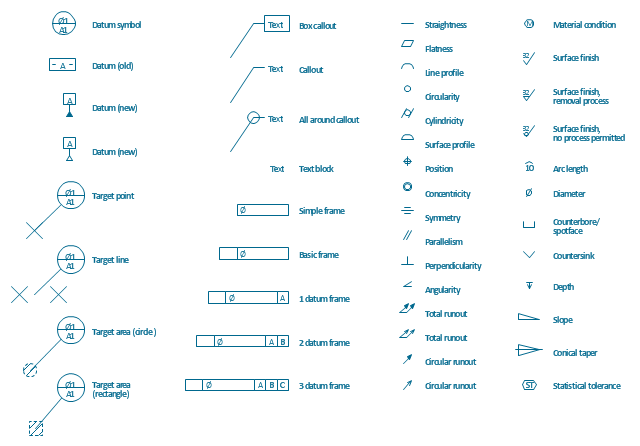
The vector stencils library "Dimensioning and tolerancing" contains 45 symbols of geometric dimensions and mechanical tolerances, geometric symbols, callouts, and text boxes and inserts.
Use these geometric dimensioning and tolerancing (GD&T) shapes to create annotated mechanical drawings.
"Geometric dimensioning and tolerancing (GD&T) is a system for defining and communicating engineering tolerances. It uses a symbolic language on engineering drawings and computer-generated three-dimensional solid models that explicitly describes nominal geometry and its allowable variation. It tells the manufacturing staff and machines what degree of accuracy and precision is needed on each controlled feature of the part. GD&T is used to define the nominal (theoretically perfect) geometry of parts and assemblies, to define the allowable variation in form and possible size of individual features, and to define the allowable variation between features." [Geometric dimensioning and tolerancing. Wikipedia]
The shapes example "Design elements - Dimensioning and tolerancing" was created using the ConceptDraw PRO diagramming and vector drawing software extended with the Mechanical Engineering solution from the ConceptDraw Solution Park.
Dimensioning and tolerancing symbols
Dimensioning and tolerancing symbols, total runout, text block, symmetry, surface, finish, roughness, surface profile, straightness, statistical tolerance, slope, position, positioning, perpendicularity, parallelism, material condition, line profile, flatness, diameter, depth, datum, reference, circle, datum, feature control, datum target, point, datum target, line, datum target, area, datum, cylindricity, countersink, counterbore, spotface, conical taper, concentricity, circularity, circular runout, callout, arc length, angularity,

Examples of Flowcharts, Org Charts and More

ConceptDraw examples covers a broad spectrum of business graphics categories. We separated all the graphic documents on application areas and had produced multiple solutions for each of them. ConceptDraw provides a wide variety of examples such as flowcharts, organizational charts, business charts, UML diagrams, database and ERD, directional map, network diagrams and lots more. Each solution accommodates 10+ examples that shows specific application cases of a diagram. ConceptDraw STORE is an application for downloading solutions with examples, templates and stencil libraries. Please choose any examples you are interested in, alternatively download them for free; you will need to install ConceptDraw to view them. As you will see, ConceptDraw is very powerful, you can use more than 10000 symbols, examples, and many pre-drawn templates, to create your own spectacular flowcharts, business diagrams, network diagrams and lots more, effortlessly, and in no time at all.
What is ConceptDraw OFFICE

Bubble diagrams in Landscape Design with ConceptDraw DIAGRAM

Creation of a bubble diagrams in ConceptDraw is an easy task as you can use the ready scanned location plan instead of plotting paper and paper location plan. Besides scanning of the ready paper location plan you can easy create it using special ConceptDraw libraries and templates for creation room plans and location plans.

SIPOC Diagram

SIPOC is a tool that summarizes the inputs and outputs of one or more processes in table form.
You need to draw professional looking SIPOC Diagram quick and easy? Pay please your attention on ConceptDraw DIAGRAM diagramming and vector drawing software. Extended with Business Process Mapping Solution from the Business Processes Area of ConceptDraw Solution Park, it suits ideal for this.

Building Drawing Software for Design Sport Fields

ConceptDraw DIAGRAM diagramming and vector drawing software enhanced with Building Plans Area allows you to draw your own plans as well as diagrams, flowcharts and many other schemes for your work.

How To Create Onion Diagram

An onion diagram is a kind of chart that shows the dependencies among parts of an organization or process. The chart displays items in concentric circles, where the items in each ring depend on the items in the smaller rings. The Onion Diagram is able to show layers of a complete system in a few circles.
But how to create Onion Diagram? Now, it's very easy thanks to the ConceptDraw DIAGRAM diagramming and vector drawing software extended with Stakeholder Onion Diagrams Solution from the Management Area of ConceptDraw Solution Park.