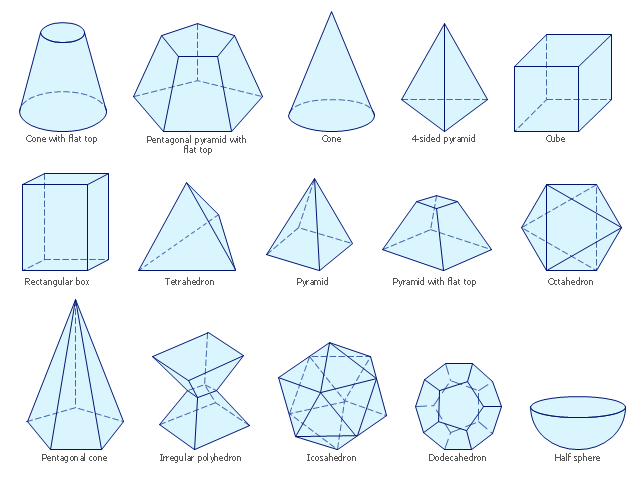
The vector stencils library "Solid geometry" contains 15 shapes of solid geometric figures.
"In mathematics, solid geometry was the traditional name for the geometry of three-dimensional Euclidean space - for practical purposes the kind of space we live in. It was developed following the development of plane geometry. Stereometry deals with the measurements of volumes of various solid figures including cylinder, circular cone, truncated cone, sphere, and prisms.
The Pythagoreans had dealt with the regular solids, but the pyramid, prism, cone and cylinder were not studied until the Platonists. Eudoxus established their measurement, proving the pyramid and cone to have one-third the volume of a prism and cylinder on the same base and of the same height, and was probably the discoverer of a proof that the volume of a sphere is proportional to the cube of its radius." [Solid geometry. Wikipedia]
The shapes example "Design elements - Solid geometry" was created using the ConceptDraw PRO diagramming and vector drawing software extended with the Mathematics solution from the Science and Education area of ConceptDraw Solution Park.
Solid geometrical figures
Basic Flowchart Symbols and Meaning


ERD Symbols and Meanings


Entity Relationship Diagram Symbols

 Object-Role Modeling (ORM) Diagrams
Object-role Modeling (ORM) Diagram solution with powerful vector diagramming and data modeling tools, large quantity of specially developed samples and examples, and rich variety of vector objects corresponding to common ORM notation, ideally suits for developing the comprehensive, clear and visual Object-role Modeling (ORM) diagrams and schematics, understandable for all interested people from the different fields and business directions, for designing the ORM models, and demonstrating advantages from the use of ORM and its notation. It is intended for software developers and computer engineers, specialists in a field of Object-oriented programming (OOP), database architects, web-application constructors and developers, etc.
Organic Chemistry Symbols

MS Visio Look a Like Diagrams

Scrum process work items and workflow

Network Glossary Definition


- Design elements - Solid geometry | Names Of Solid Figures Geometry
- Design elements - Solid geometry | Bio Flowchart Lite | Design ...
- Design elements - Solid geometry | Design elements - UML object ...
- Design elements - Solid geometry | Mathematics Symbols | How to ...
- Design elements - Solid geometry | Stereometric Figures
- Design elements - Solid geometry | Cross-Functional Flowchart ...
- Name Of Geometric Shapes Flat Top Pyramid
- Design elements - Solid geometry | Design elements - Sequence ...
- Design elements - Solid geometry | How to Draw Geometric Shapes ...
- Solid geometry - Vector stencils library | Platonic solids | Design ...