The vector stencils library "Circular diagrams" contains 42 templates of circular diagrams: circular arrow diagram, circular motion diagram, arrow ring chart, doughnut chart (donut chart), circle pie chart, diamond pie chart, circle diagram, pie chart, ring chart, loop diagram, block loop diagram, arrow loop circle, crystal diagram, triangular diagram, diamond diagram, pentagon diagram, hexagon diagram, heptagon diagram, cycle diagram (cycle chart), stacked Venn diagram (onion diagram), arrow circle diagram.
Use these shapes to illustrate your marketing and sales documents, presentations, webpages and infographics in the ConceptDraw PRO diagramming and vector drawing software extended with the Target and Circular Diagrams solution from the Marketing area of ConceptDraw Solution Park.
www.conceptdraw.com/ solution-park/ marketing-target-and-circular-diagrams
Circular arrow diagram 1
Circular arrow diagram 2
Arrow ring chart
Doughnut chart

Diamond pie chart

Pie chart

Circle diagram

Circle pie chart 2

Circle pie chart 1

Ring chart 1 - 3 elements

Ring chart 1 - 4 elements

Ring chart 1 - 5 elements

Ring chart 1 - 6 elements

Ring chart 1 - 7 elements

Ring chart 2 - 3 elements

Ring chart 2 - 4 elements

Ring chart 2 - 5 elements

Ring chart 2 - 6 elements

Ring chart 2 - 7 elements

Crystal diagram - 3 elements

Crystal diagram - 4 elements

Crystal diagram - 5 elements

Crystal diagram - 6 elements

Crystal diagram - 7 elements

Stacked Venn diagram - 4

Stacked Venn diagram - 5

Stacked Venn diagram - 6

Stacked Venn diagram - 7

Basic loop diagram

Block loop diagram

Arrow loop circle
Arrow loop - 3 circles
Arrow loop - 4 circles
Arrow loop - 5 circles
Arrow loop - 6 circles
Arrow loop - 7 circles
Arrow circle diagram - 3
Arrow circle diagram - 4
Stacked Venn diagram - 3

Arrow circle diagram - 5
Arrow circle diagram - 6
Arrow circle diagram - 7
HelpDesk
How to Create a Timeline Diagram in ConceptDraw PRO

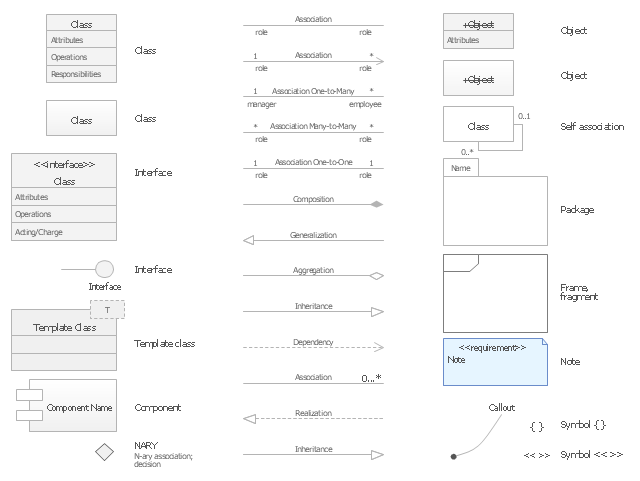
The vector stencils library "UML class diagrams" contains 38 symbols for the ConceptDraw PRO diagramming and vector drawing software.
"... classes are represented with boxes which contain three parts:
(1) The top part contains the name of the class. It is printed in Bold, centered and the first letter capitalized.
(2) The middle part contains the attributes of the class. They are left aligned and the first letter is lower case.
(3) The bottom part gives the methods or operations the class can take or undertake. They are also left aligned and the first letter is lower case. ...
To indicate a classifier scope for a member, its name must be underlined. ...
An association can be named, and the ends of an association can be adorned with role names, ownership indicators, multiplicity, visibility, and other properties. ...
Aggregation ... is graphically represented as a hollow diamond shape on the containing class end of the tree with a single line that connects the contained class to the containing class.
... graphical representation of a composition relationship is a filled diamond shape on the containing class end of the tree of lines that connect contained class(es) to the containing class.
... graphical representation of a Generalization is a hollow triangle shape on the superclass end of the line (or tree of lines) that connects it to one or more subtypes.
... graphical representation of a Realization is a hollow triangle shape on the interface end of the dashed line (or tree of lines) that connects it to one or more implementers. A plain arrow head is used on the interface end of the dashed line that connects it to its users.
Multiplicity ... representation of an association is a line with an optional arrowhead indicating the role of the object(s) in the relationship, and an optional notation at each end indicating the multiplicity of instances of that entity (the number of objects that participate in the association).
Entity classes ... are drawn as circles with a short line attached to the bottom of the circle. Alternatively, they can be drawn as normal classes with the «entity» stereotype notation above the class name." [Class diagram. Wikipedia]
The example "Design elements - UML class diagrams" is included in the Rapid UML solution from the Software Development area of ConceptDraw Solution Park.
UML class diagram symbols
HelpDesk
How to Create a Business Process Diagram

DroidDia PRO unlocker
.jpg "droiddia pro unlocker")
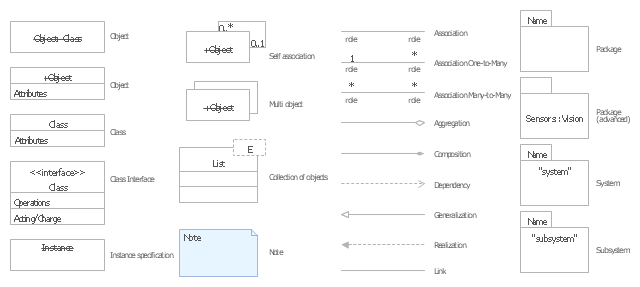
The vector stencils library "UML object diagrams" contains 26 symbols for the ConceptDraw PRO diagramming and vector drawing software.
"Each object and link on an object diagram is represented by an InstanceSpecification. This can show an object's classifier (e.g. an abstract or concrete class) and instance name, as well as attributes and other structural features using slots. Each slot corresponds to a single attribute or feature, and may include a value for that entity.
The name on an instance specification optionally shows an instance name, a ':' separator, and optionally one or more classifier names separated by commas. The contents of slots, if any, are included below the names, in a separate attribute compartment. A link is shown as a solid line, and represents an instance of an association. ...
If you are using a UML modeling tool, you will typically draw object diagrams using some other diagram type, such as on a class diagram. An object instance may be called an instance specification or just an instance. A link between instances is generally referred to as a link. Other UML entities, such as an aggregation or composition symbol (a diamond) may also appear on an object diagram." [Object diagram. Wikipedia]
The example "Design elements - UML object diagrams" is included in the Rapid UML solution from the Software Development area of ConceptDraw Solution Park.
UML object diagram symbols
- Softball Diamond Diagram
- Baseball diamond | Baseball Solution. ConceptDraw.com | Colored ...
- Baseball Diamond Drawing
- Content marketing cycle - Diamond pie chart | Recycle Diagram
- ERD Symbols and Meanings | Entity Relationship Diagram Symbols ...
- Colored Baseball Field Diagram | Baseball Diagram – Colored ...
- Baseball Diagram – Baseball Field – Corner View – Sample ...
- Entity Relationship Software | Business Process Workflow Diagram ...
- Colored Baseball Field Diagram | Baseball | Simple baseball field ...
- Diagram Of Purchasing System Flowchart Of Diamond Bank
- E-R Diagrams | ConceptDraw PRO ER Diagram Tool | ERD ...
- Colored Baseball Field Diagram | Baseball Field Schema | Simple ...
- Diagram Baseball Field
- Baseball diamond | Baseball Field Schema | Colored Baseball Field ...
- Baseball | Colored Baseball Field Diagram | Baseball Field Sample ...
- Baseball | Baseball Diagram – Baseball Field – Corner View ...
- Target and Circular Diagrams | Circular Flow Diagram Template ...
- Baseball | Baseball Diagram – Baseball Field – Corner View ...
- The Diamond Symbol Is Used In A Flowcharting Represent What
- Circular diagrams - Vector stencils library | Circular Arrows | Basic ...
- ERD | Entity Relationship Diagrams, ERD Software for Mac and Win
- Flowchart | Basic Flowchart Symbols and Meaning
- Flowchart | Flowchart Design - Symbols, Shapes, Stencils and Icons
- Flowchart | Flow Chart Symbols
- Electrical | Electrical Drawing - Wiring and Circuits Schematics
- Flowchart | Common Flowchart Symbols
- Flowchart | Common Flowchart Symbols