The vector stencils library "EPC diagrams" contains 23 EPC symbols.
Use it for drawing event-driven process chain (EPC) diagrams in the ConceptDraw PRO diagramming and vector drawing software extended with the Event-driven Process Chain Diagrams solution from the Business Processes area of ConceptDraw Solution Park.
www.conceptdraw.com/ solution-park/ business-process-EPC
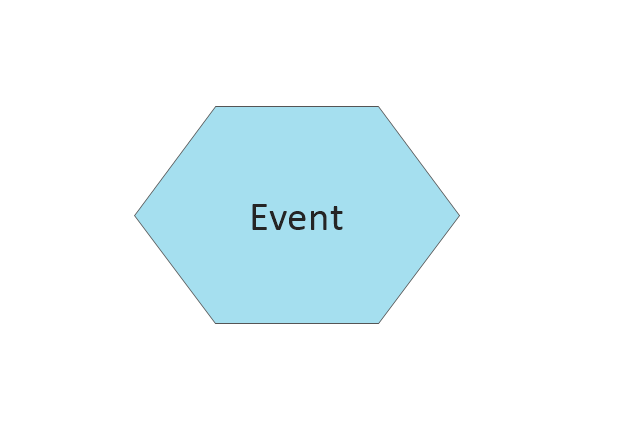
Event
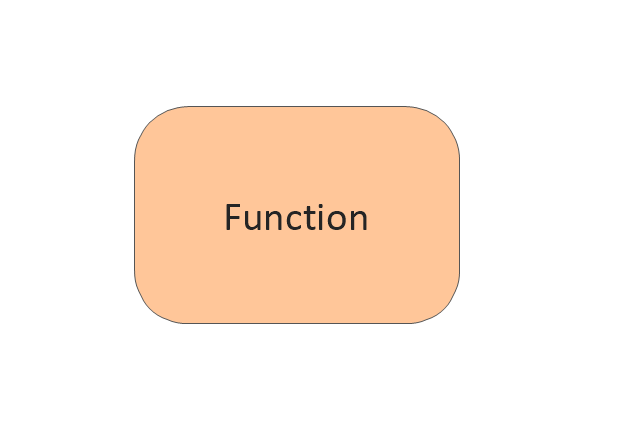
Function
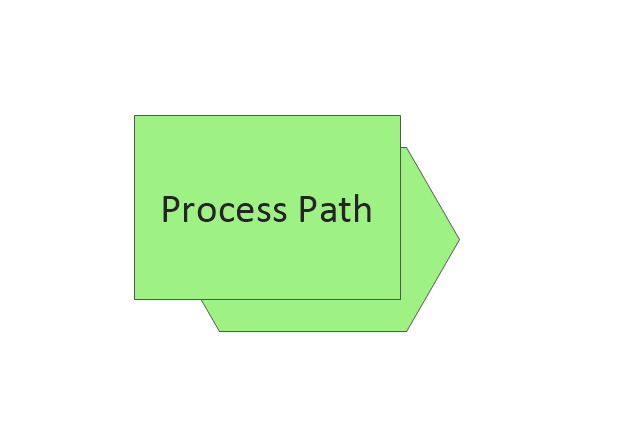
Process path
XOR operator

OR operator

AND operator

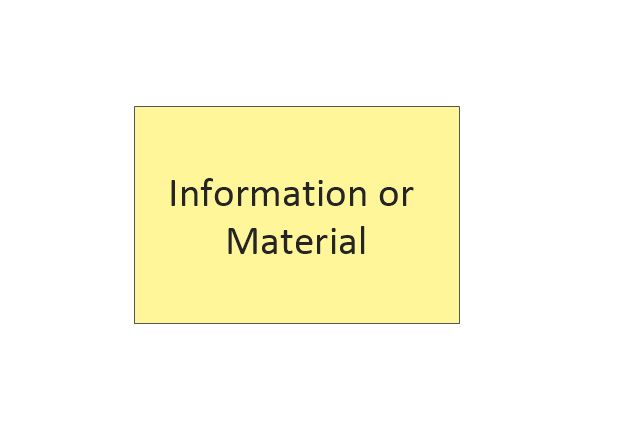
Information/ Material Object
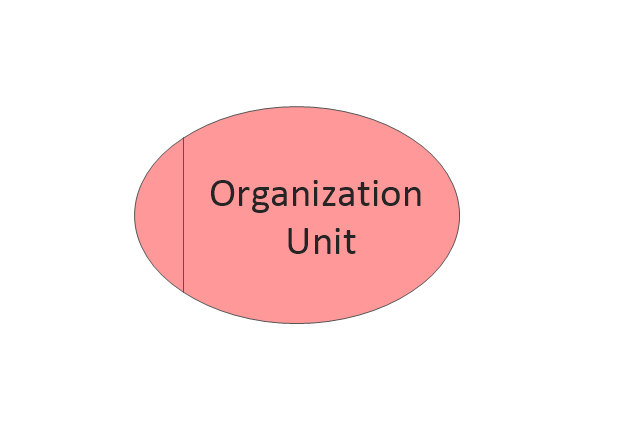
Organization Unit
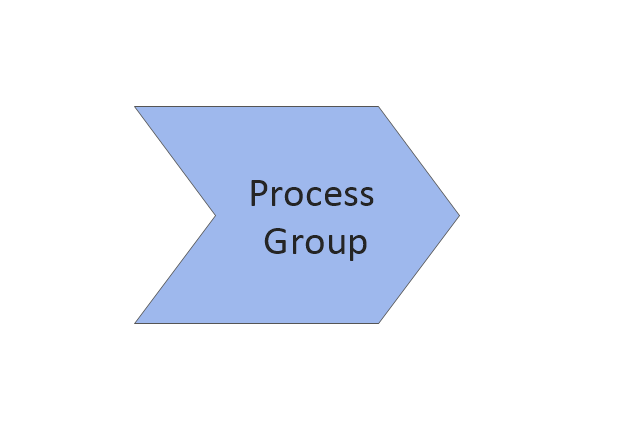
Process Group
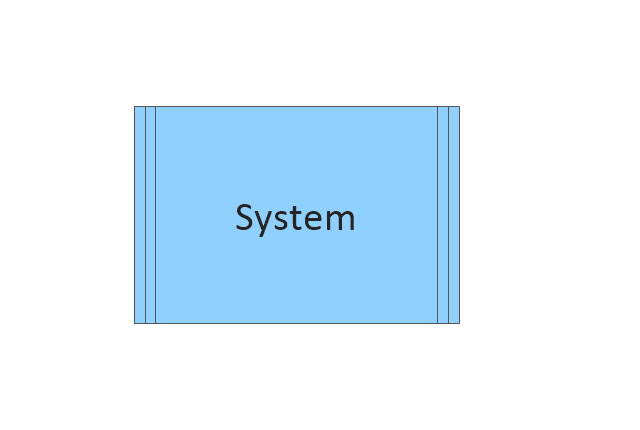
System
Comment 1

Comment 2

Control flow (Direct)
-epc-diagrams---vector-stencils-library.png--diagram-flowchart-example.png)
Information flow (Direct)
-epc-diagrams---vector-stencils-library.png--diagram-flowchart-example.png)
Organiztion unit assignment (Direct)
-epc-diagrams---vector-stencils-library.png--diagram-flowchart-example.png)
Control flow (Smart)
-epc-diagrams---vector-stencils-library.png--diagram-flowchart-example.png)
Information flow (Smart)
-epc-diagrams---vector-stencils-library.png--diagram-flowchart-example.png)
Organiztion unit assignment (Smart)
-epc-diagrams---vector-stencils-library.png--diagram-flowchart-example.png)
Information

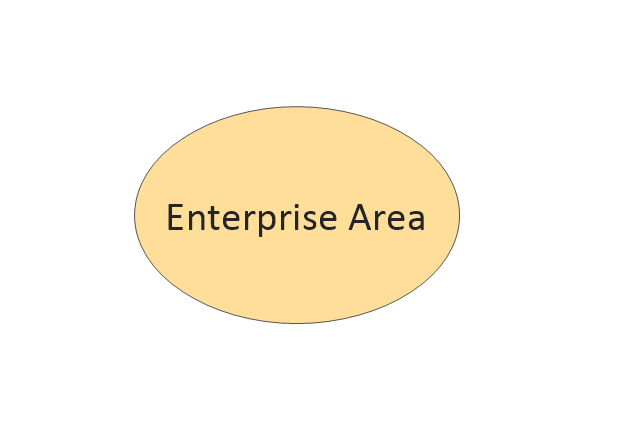
Enterprise Area
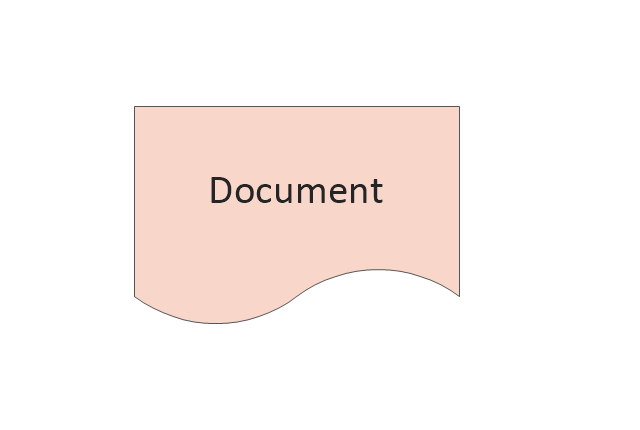
Document
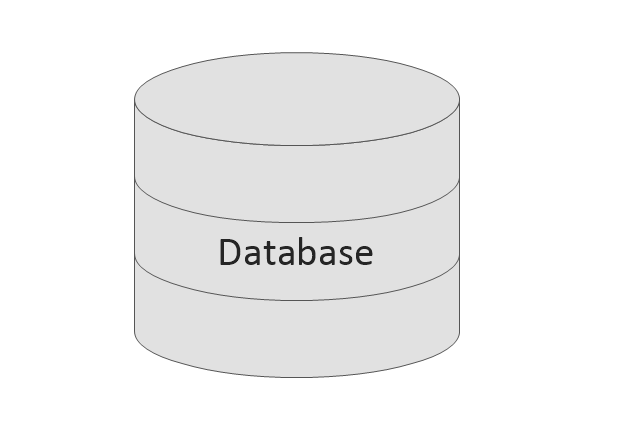
Database
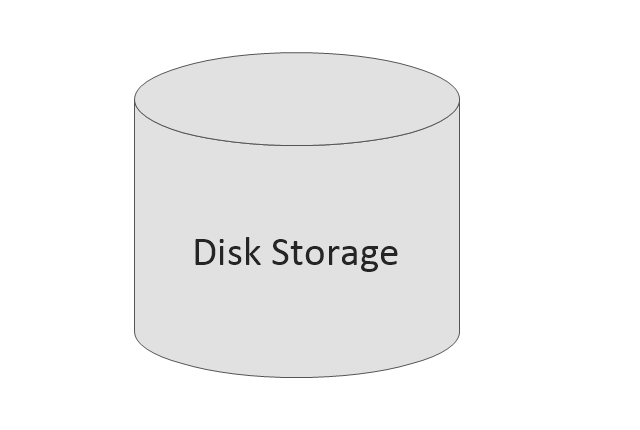
Disk Storage
 IDEF0 Diagrams
IDEF0 Diagrams visualize system models using the Integration Definition for Function Modeling (IDEF) methodology. Use them for analysis, development and integration of information and software systems, and business process modelling.
HelpDesk
Event-driven Process Chain (EPC) Diagram Software

An EPC diagram shows different business processes through various workflows. The workflows are seen as functions and events that are connected by different teams or people, as well as tasks that allow business processes to be executed. The best thing about this type of enterprise modelling is that creating an EPC diagram is quick and simple as long as you have the proper tool. One of the main usages of the EPC diagrams is in the modelling, analyzing and re-engineering of business processes. With the use of the flowchart, businesses are able to see inefficiencies in the processes and modify to make them more productive. Event-driven process chain diagrams are also used to configure an enterprise resource pla
HelpDesk
How to Start Drawing a Diagram on Mac

There are many types of diagrams, you can create using Conceptdraw PRO: network diagrams, organizational charts, flow charts, workflow diagrams, technical schemes and building plans. However, there are the same basic steps to start creating almost all of them. Here tutorial we will show how to create a simple chart using a template, and how to add shapes to your drawing using libraries.
In this tutorial we will explain how to create a simple chart in ConceptDraw PRO using a template, and how to use the library objects.
HelpDesk
How to Draw a Circular Arrows Diagram Using ConceptDraw PRO

- Dfd Diagram Of Library Function
- DFD Library System | Data Flow Diagrams | Example of DFD for ...
- Dfd Symbol Using Standard Graphics Library Function Program
- Function Block Diagram Library
- DFD Library System | Data Flow Diagram Symbols. DFD Library ...
- Data Flow Diagram Symbols. DFD Library | Basic Flowchart ...
- Flowchart Of Library Functions
- Process Flowchart | ERD Symbols and Meanings | Software ...
- DFD Library System | Process Flowchart | Context Diagram ...
- Context Diagram Template | DFD Library System | Data Flow ...
- DFD Library System | Context Diagram Template | IDEF0 Diagrams ...
- Function Modeling Symbols
- UML Block Diagram
- DFD Library System | Data Flow Diagram Symbols. DFD Library ...
- Entity-Relationship Diagram (ERD) | DFD Library System | ERD ...
- Diagram About Function Of Communication
- Data Flow Diagram Symbols. DFD Library | Basic Flowchart ...
- Function Model Block Diagram
- Data Flow Diagram Symbols. DFD Library
- Functional Block Diagram | Block Diagram | SysML block definition ...
- ERD | Entity Relationship Diagrams, ERD Software for Mac and Win
- Flowchart | Basic Flowchart Symbols and Meaning
- Flowchart | Flowchart Design - Symbols, Shapes, Stencils and Icons
- Flowchart | Flow Chart Symbols
- Electrical | Electrical Drawing - Wiring and Circuits Schematics
- Flowchart | Common Flowchart Symbols
- Flowchart | Common Flowchart Symbols