 ConceptDraw Solution Park
ConceptDraw Solution Park collects graphic extensions, examples and learning materials
This circle-spoke diagram sample illustrates the target market concept.
"A target market is a group of customers towards which a business has decided to aim its marketing efforts and ultimately its merchandise. A well-defined target market is the first element to a marketing strategy. The marketing mix variables of product, place (distribution), promotion and price are the four elements of a marketing mix strategy that determine the success of a product in the marketplace." [Target market. Wikipedia]
The hub-and-spoke diagram example "Target market" was created using the ConceptDraw PRO diagramming and vector drawing software extended with the Circle-Spoke Diagrams solution from the area "What is a Diagram" of ConceptDraw Solution Park.
Circle-spoke diagram

HelpDesk
How to Draw a Circle-Spoke Diagram Using ConceptDraw PRO

Flowchart Marketing Process. Flowchart Examples

HelpDesk
How to Draw a Circular Arrows Diagram Using ConceptDraw PRO

 Fishbone Diagram
Fishbone Diagrams solution extends ConceptDraw PRO software with templates, samples and library of vector stencils for drawing the Ishikawa diagrams for cause and effect analysis.
 Entity-Relationship Diagram (ERD)
Entity-Relationship Diagram (ERD) solution extends ConceptDraw PRO software with templates, samples and libraries of vector stencils from drawing the ER-diagrams by Chen's and crow’s foot notations.
What Is a Concept Map

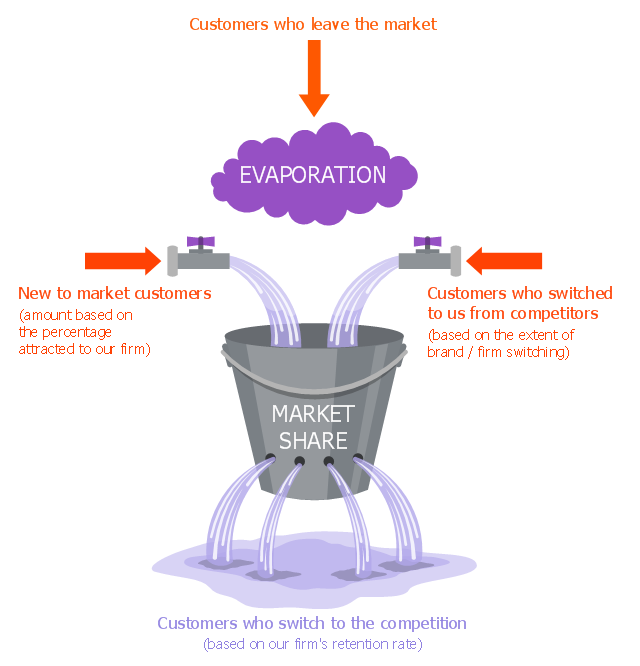
"The leaky bucket theory The leaky bucket theory is the model that seeks to describe the process of customer gain and loss, otherwise known as customer churn . Customer retention is one of the key concepts in relationship marketing. Most companies concentrate on recruiting new customers to replace customers who move on, rather than seeking to retain customers." [Blythe J. Key Concepts in Marketing. 2009. knowledge.sagepub.com/ view/ key-concepts-in-marketing/ n5.xml]
"Customer attrition, also known as customer churn, customer turnover, or customer defection, is the loss of clients or customers.
Banks, telephone service companies, Internet service providers, pay TV companies, insurance firms, and alarm monitoring services, often use customer attrition analysis and customer attrition rates as one of their key business metrics (along with cash flow, EBITDA, etc.) because the "...cost of retaining an existing customer is far less than acquiring a new one." Companies from these sectors often have customer service branches which attempt to win back defecting clients, because recovered long-term customers can be worth much more to a company than newly recruited clients." [Customer attrition. Wikipedia]
The example "Leaky bucket diagram" was created using the ConceptDraw PRO diagramming and vector drawing software extended with the Marketing Diagrams solution from the Marketing area of ConceptDraw Solution Park.
Leaky bucket diagram
 Marketing Diagrams
This solution extends ConceptDraw PRO with samples, templates and library of design elements for drawing the marketing diagrams.
 Pyramid Diagrams
Pyramid Diagrams solution extends ConceptDraw PRO software with templates, samples and library of vector stencils for drawing the marketing pyramid diagrams.
 Circle-Spoke Diagrams
Examples of subject areas that are well suited to this approach are marketing, business, products promotion, process modeling, market, resource, time, and cost analysis. Circle-Spoke Diagrams are successfully used in presentations, conferences, management documents, magazines, reportages, reviews, reports, TV, and social media.
 Venn Diagrams
Venn Diagrams are actively used to illustrate simple set relationships in set theory and probability theory, logic and statistics, mathematics and computer science, linguistics, sociology, and marketing. Venn Diagrams are also often used to visually summarize the status and future viability of a project.
 Target and Circular Diagrams
This solution extends ConceptDraw PRO software with samples, templates and library of design elements for drawing the Target and Circular Diagrams.
The Best Mac Software for Diagramming or Drawing


- Societal Marketing Concept Diagram
- Concept Of Product Market With Diagram
- Diagram Marketing Concept
- Concept Of Marketing With Diagram
- Target market | How to Draw a Circular Arrows Diagram Using ...
- Internet marketing - Concept map | What Is a Concept Map | Leaky ...
- Marketing | Fishbone Diagram | Marketing Diagrams | Concept Of ...
- Internet marketing - Concept map | Concept Maps | What Is a ...
- Target Diagram | Target market | Circle Spoke Diagram Template ...
- Marketing mix - Wheel diagram | Marketing Diagrams | Marketing ...
- Internet marketing - Concept map | What Is a Concept Map ...
- Internet marketing - Concept map | How to Draw a Circular Arrows ...
- Diagram Of The Market
- Marketing plan - Circular diagram | Market value - Pyramid diagram ...
- Marketing Diagrams | Marketing plan - Circular diagram | Internet ...
- Spoke Diagram
- Marketing Concept Diagram
- Marketing mix - Wheel diagram | Marketing Diagrams | Target ...
- Internet marketing professions | Internet marketing - Concept map ...
- Six Markets Model Chart | Market value - Pyramid diagram | Market ...