UML Component Diagram Example - Online Shopping

State Diagram Example — Online Store

Online Diagram Tool
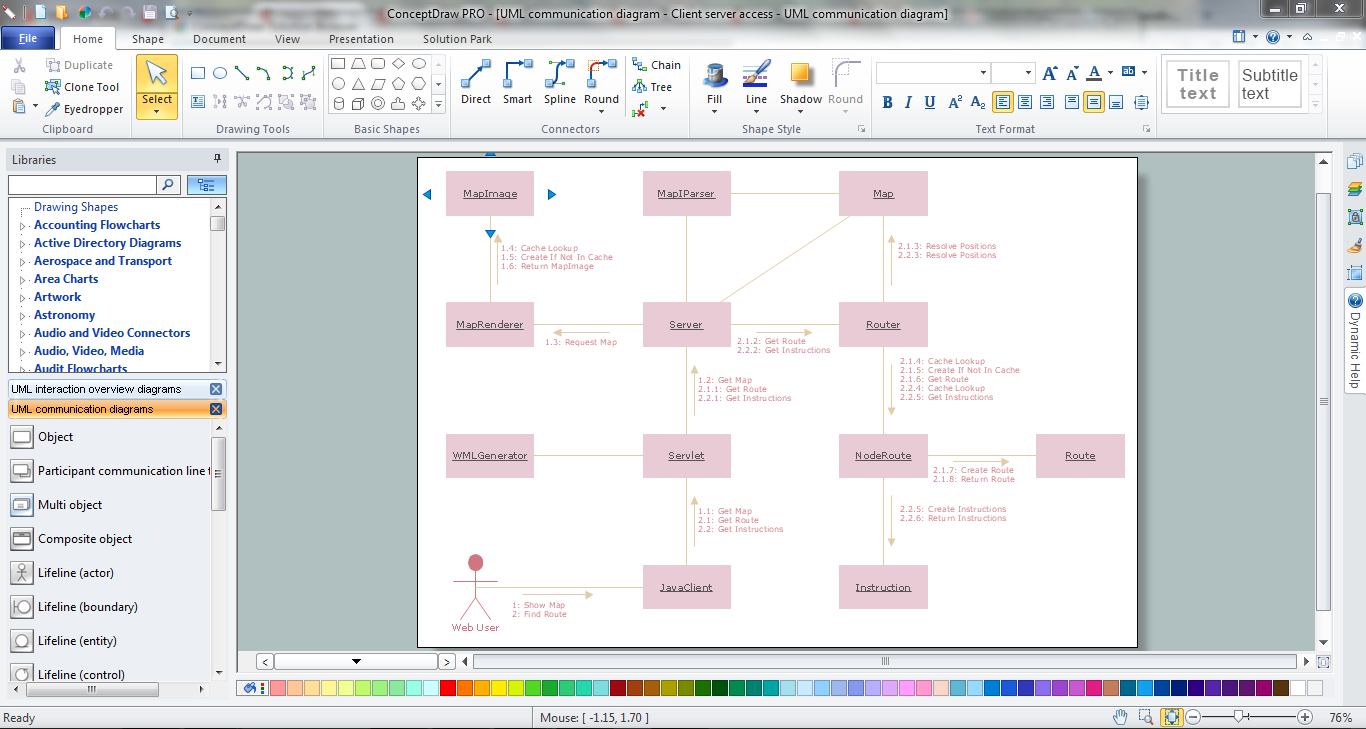
UML Collaboration Diagram (UML2.0)


"Online shopping or e-shopping is a form of electronic commerce which allows consumers to directly buy goods or services from a seller over the Internet using a web browser. Alternative names are: e-web-store, e-shop, e-store, Internet shop, web-shop, web-store, online store, online storefront and virtual store. Mobile commerce (or m-commerce) describes purchasing from an online retailer's mobile optimized online site or app.
An online shop evokes the physical analogy of buying products or services at a bricks-and-mortar retailer or shopping center; the process is called business-to-consumer (B2C) online shopping. In the case where a business buys from another business, the process is called business-to-business (B2B) online shopping. The largest of these online retailing corporations are Alibaba, Amazon.com, and eBay. Retail success is no longer all about physical stores. This is evident because of the increase in retailers now offering online store interfaces for consumers. With the growth of online shopping, comes a wealth of new market footprint coverage opportunities for stores that can appropriately cater to offshore market demands and service requirements." [Online shopping. Wikipedia]
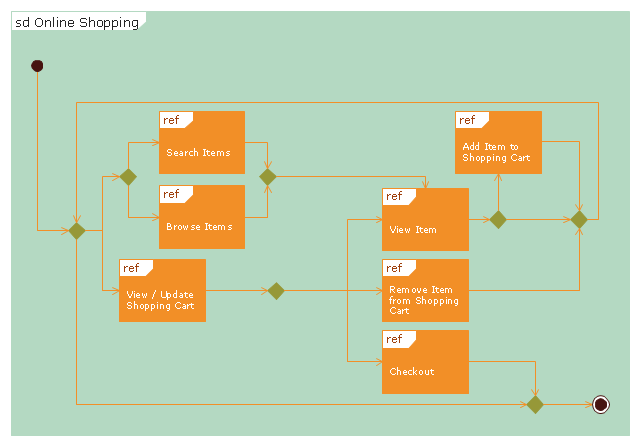
The UML interaction overview diagram example "Online shopping" was created using the ConceptDraw PRO diagramming and vector drawing software extended with the Rapid UML solution from the Software Development area of ConceptDraw Solution Park.
An online shop evokes the physical analogy of buying products or services at a bricks-and-mortar retailer or shopping center; the process is called business-to-consumer (B2C) online shopping. In the case where a business buys from another business, the process is called business-to-business (B2B) online shopping. The largest of these online retailing corporations are Alibaba, Amazon.com, and eBay. Retail success is no longer all about physical stores. This is evident because of the increase in retailers now offering online store interfaces for consumers. With the growth of online shopping, comes a wealth of new market footprint coverage opportunities for stores that can appropriately cater to offshore market demands and service requirements." [Online shopping. Wikipedia]
The UML interaction overview diagram example "Online shopping" was created using the ConceptDraw PRO diagramming and vector drawing software extended with the Rapid UML solution from the Software Development area of ConceptDraw Solution Park.
UML interaction overview diagram
Example of DFD for Online Store (Data Flow Diagram)


"Banks offer many different channels to access their banking and other services:
(1) Automated Teller Machines.
(2) A branch is a retail location.
(3) Call center.
(4) Mail: most banks accept cheque deposits via mail and use mail to communicate to their customers, e.g. by sending out statements.
(5) Mobile banking is a method of using one's mobile phone to conduct banking transactions.
(6) Online banking is a term used for performing multiple transactions, payments etc. over the Internet.
(7) Relationship Managers, mostly for private banking or business banking, often visiting customers at their homes or businesses.
(8) Telephone banking is a service which allows its customers to conduct transactions over the telephone with automated attendant or when requested with telephone operator.
(9) Video banking is a term used for performing banking transactions or professional banking consultations via a remote video and audio connection. Video banking can be performed via purpose built banking transaction machines (similar to an Automated teller machine), or via a video conference enabled bank branch clarification.
(10) DSA is a Direct Selling Agent, who works for the bank based on a contract. Its main job is to increase the customer base for the bank." [Bank. Wikipedia]
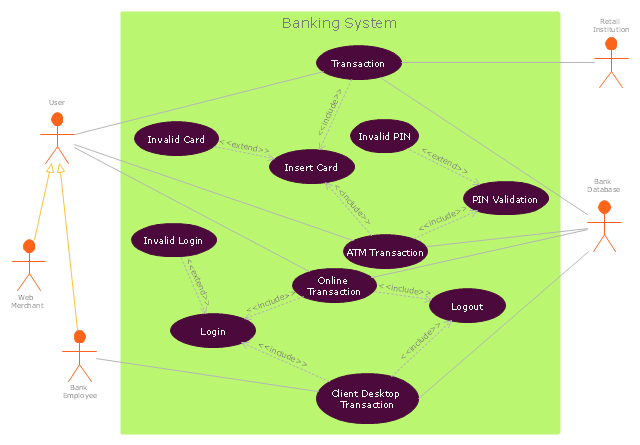
The UML use case diagram example "Banking system" was created using the ConceptDraw PRO diagramming and vector drawing software extended with the Rapid UML solution from the Software Development area of ConceptDraw Solution Park.
(1) Automated Teller Machines.
(2) A branch is a retail location.
(3) Call center.
(4) Mail: most banks accept cheque deposits via mail and use mail to communicate to their customers, e.g. by sending out statements.
(5) Mobile banking is a method of using one's mobile phone to conduct banking transactions.
(6) Online banking is a term used for performing multiple transactions, payments etc. over the Internet.
(7) Relationship Managers, mostly for private banking or business banking, often visiting customers at their homes or businesses.
(8) Telephone banking is a service which allows its customers to conduct transactions over the telephone with automated attendant or when requested with telephone operator.
(9) Video banking is a term used for performing banking transactions or professional banking consultations via a remote video and audio connection. Video banking can be performed via purpose built banking transaction machines (similar to an Automated teller machine), or via a video conference enabled bank branch clarification.
(10) DSA is a Direct Selling Agent, who works for the bank based on a contract. Its main job is to increase the customer base for the bank." [Bank. Wikipedia]
The UML use case diagram example "Banking system" was created using the ConceptDraw PRO diagramming and vector drawing software extended with the Rapid UML solution from the Software Development area of ConceptDraw Solution Park.
UML use case diagram
 ConceptDraw Solution Park
ConceptDraw Solution Park collects graphic extensions, examples and learning materials
UML Activity Diagram

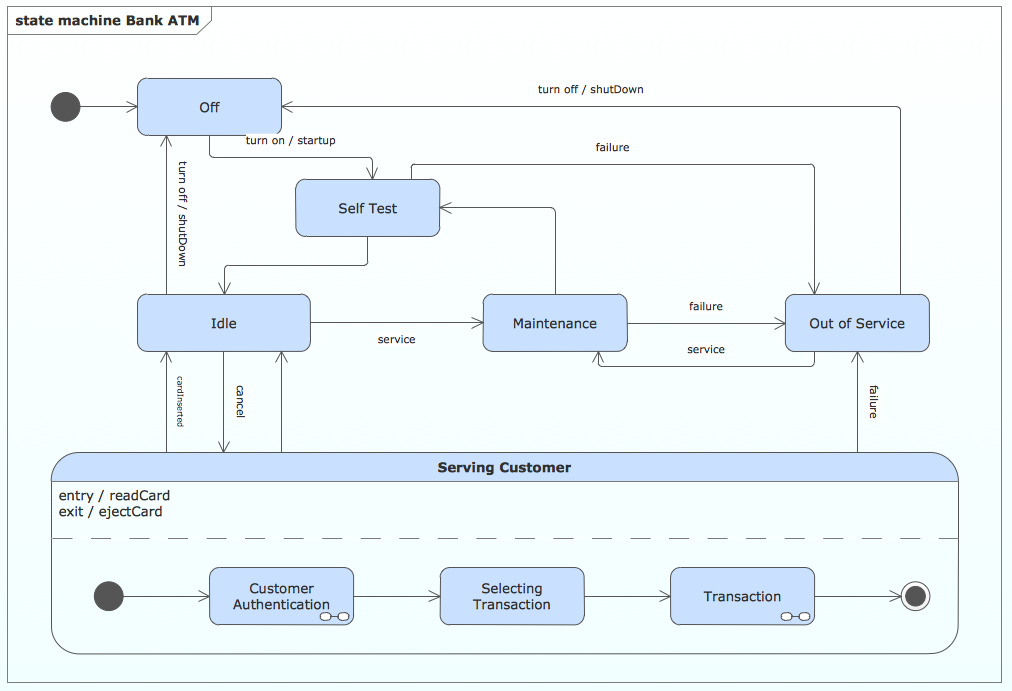
State Machine Diagram
ConceptDraw Solution Park
ConceptDraw Solution Park collects graphic extensions, examples and learning materials
 Fault Tree Analysis Diagrams
This solution extends ConceptDraw DIAGRAM.5 or later with templates, fault tree analysis example, samples and a library of vector design elements for drawing FTA diagrams (or negative analytical trees), cause and effect diagrams and fault tree diagrams.
 Fishbone Diagram
Fishbone Diagrams solution extends ConceptDraw DIAGRAM software with templates, samples and library of vector stencils for drawing the Ishikawa diagrams for cause and effect analysis.
HelpDesk
How to Create a Timeline Diagram

UML Deployment Diagram
 Business Process Diagrams
Business Process Diagrams solution extends the ConceptDraw DIAGRAM BPM software with RapidDraw interface, templates, samples and numerous libraries based on the BPMN 1.2 and BPMN 2.0 standards, which give you the possibility to visualize equally easy simple and complex processes, to design business models, to quickly develop and document in details any business processes on the stages of project’s planning and implementation.
 Fishbone Diagrams
The Fishbone Diagrams solution extends ConceptDraw DIAGRAM software with the ability to easily draw the Fishbone Diagrams (Ishikawa Diagrams) to clearly see the cause and effect analysis and also problem solving. The vector graphic diagrams produced using this solution can be used in whitepapers, presentations, datasheets, posters, and published technical material.
 Entity-Relationship Diagram (ERD)
Entity-Relationship Diagram (ERD) solution extends ConceptDraw DIAGRAM software with templates, samples and libraries of vector stencils from drawing the ER-diagrams by Chen's and crow’s foot notations.
- UML Component Diagram Example - Online Shopping | UML Tool ...
- UML Component Diagram
- State Diagram Example - Online Store | UML Component Diagram ...
- UML Component Diagram Example - Online Shopping | State ...
- UML Component Diagram Example - Online Shopping | UML Use ...
- Example of DFD for Online Store (Data Flow Diagram ) DFD ...
- Online Diagram Tool | UML Component Diagram Example - Online ...
- UML Component Diagram | Diagramming Software for Design UML ...
- State Diagram Example - Online Store | UML Component Diagram ...
- UML Component Diagram Example - Online Shopping ...
- How to create your UML Diagram | UML Tool & UML Diagram ...
- Diagramming Software for Design UML Component Diagrams | UML ...
- UML Deployment Diagram
- UML Use Case Diagram Example Registration System | Rapid UML ...
- UML Tool & UML Diagram Examples
- UML Tool & UML Diagram Examples | State Diagram Example ...
- ConceptDraw Solution Park | UML Component Diagram Example ...
- UML Component Diagram Example - Online Shopping | How to ...
- UML Class Diagram Example - Medical Shop | UML Component ...
- UML Component Diagram Example - Online Shopping | UML ...