 Timeline Diagrams
Timeline Diagrams solution extends ConceptDraw PRO software with templates, samples and library of vector stencils for drawing the timeline and milestones diagrams.
HelpDesk
How to Create a Timeline Diagram in ConceptDraw PRO

Timeline charts presents events and time periods on a chronological scale. They are used in project management to visualize project milestones and upper level phases, and show project progress.
"Within the framework of project management, a milestone is an event that receives special attention. It is often put at the end of a stage to mark the completion of a work package or phase. Milestones can be put before the end of a phase so that corrective actions can be taken, if problems arise, and the deliverable can be completed on time.
In addition to signaling the completion of a key deliverable, a milestone may also signify an important decision or the derivation of a critical piece of information, which outlines or affects the future of a project. In this sense, a milestone not only signifies distance traveled (key stages in a project) but also indicates direction of travel since key decisions made at milestones may alter the route through the project plan." [Milestone (project management). Wikipedia]
This timeline diagram example was created using the ConceptDraw PRO diagramming and vector drawing software extended with the Timeline Diagrams solution from the Management area of ConceptDraw Solution Park.
Timeline

How to Make a Timeline

"A project plan, according to the Project Management Body of Knowledge, is: "...a formal, approved document used to guide both project execution and project control. The primary uses of the project plan are to document planning assumptions and decisions, facilitate communication among stakeholders, and document approved scope, cost, and schedule baselines. A project plan may be summarized or detailed." ...
The objective of a project plan is to define the approach to be used by the Project team to deliver the intended project management scope of the project.
At a minimum, a project plan answers basic questions about the project:
Why? - What is the problem or value proposition addressed by the project? Why is it being sponsored?
What? - What is the work that will be performed on the project? What are the major products/ deliverables?
Who? - Who will be involved and what will be their responsibilities within the project? How will they be organized?
When? - What is the project timeline and when will particularly meaningful points, referred to as milestones, be complete?" [Project plan. Wikipedia]
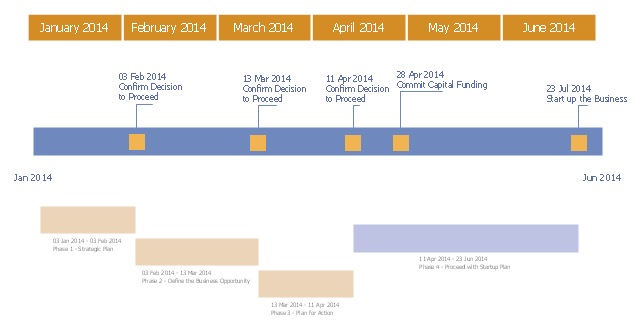
The timeline diagram example "New business project plan" was created using the ConceptDraw PRO diagramming and vector drawing software extended with the Timeline Diagrams solution from the Management area of ConceptDraw Solution Park.
The objective of a project plan is to define the approach to be used by the Project team to deliver the intended project management scope of the project.
At a minimum, a project plan answers basic questions about the project:
Why? - What is the problem or value proposition addressed by the project? Why is it being sponsored?
What? - What is the work that will be performed on the project? What are the major products/ deliverables?
Who? - Who will be involved and what will be their responsibilities within the project? How will they be organized?
When? - What is the project timeline and when will particularly meaningful points, referred to as milestones, be complete?" [Project plan. Wikipedia]
The timeline diagram example "New business project plan" was created using the ConceptDraw PRO diagramming and vector drawing software extended with the Timeline Diagrams solution from the Management area of ConceptDraw Solution Park.
Project timeline
Timeline Examples

Timeline Diagrams

ConceptDraw PRO extended with Timeline Diagrams solution from the Management area of ConceptDraw Solution Park is a powerful software for fast and easy drawing useful and great-looking timeline diagrams.
Project Timeline

You need to make professional looking project timeline? Create it with ConceptDraw PRO! ConceptDraw PRO extended with Timeline Diagrams Solution from the Management Area is the best timeline diagrams software
Timeline charts presents events and time periods on a chronological scale. They are used in project management to visualize project milestones and upper level phases, and show project progress.
"... timeline is used for project management. In these cases, timelines are used to help team members to know what milestones need to be achieved and under what time schedule. For example, in the case of establishing a project timeline in the implementation phase of the life cycle of a computer system." [Timeline. Wikipedia]
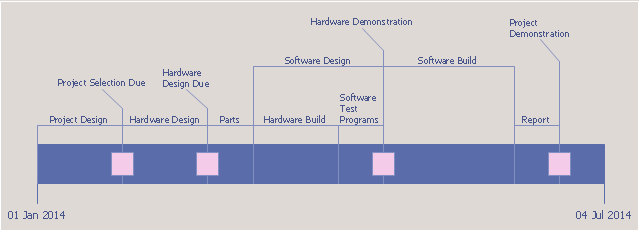
This project timeline diagram example was created using the ConceptDraw PRO diagramming and vector drawing software extended with the Timeline Diagrams solution from the Management area of ConceptDraw Solution Park.
"... timeline is used for project management. In these cases, timelines are used to help team members to know what milestones need to be achieved and under what time schedule. For example, in the case of establishing a project timeline in the implementation phase of the life cycle of a computer system." [Timeline. Wikipedia]
This project timeline diagram example was created using the ConceptDraw PRO diagramming and vector drawing software extended with the Timeline Diagrams solution from the Management area of ConceptDraw Solution Park.
Project timeline
 Business Processes
Business Process solution extends ConceptDraw PRO software with business process diagrams as cross-functional flowcharts, workflows, process charts, IDEF0, timelines, calendars, Gantt charts, business process modeling, audit and opportunity flowcharts.
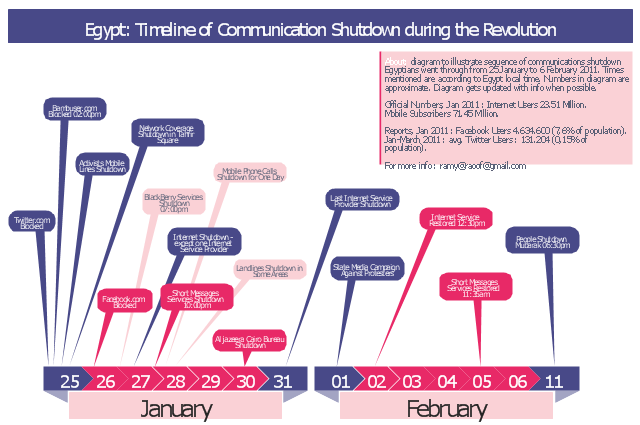
This typography infographics example was redesigned from the Wikimedia Commons file: Egypt timeline of communication shutdown during jan25revolution.jpg. [commons.wikimedia.org/ wiki/ File:Egypt_ timeline_ of_ communication_ shutdown_ during_ jan25revolution.jpg]
This file is licensed under the Creative Commons Attribution 3.0 Unported license. [creativecommons.org/ licenses/ by/ 3.0/ deed.en]
Diagram to illustrate sequence of communications shutdown Egyptians went through from 25 January to 06 February 2011. Times mentioned are according to Egypt local time. Numbers in the diagram are approximate. Last update of the diagram October 2011.
"2011 Internet shutdown.
Diagram to illustrate sequence of communications shutdown Egyptians went through from 25 January to 06 February 2011. Times mentioned are according to Egypt local time. Numbers in the diagram are approximate. Last update of the diagram October 2011.
The 2011 Egyptian protests began on 25 January 2011. As a result, on January 25 and 26, the government blocked Twitter in Egypt and later Facebook was blocked as well.
On January 27, various reports claimed that access to the Internet in the entire country had been shut down. ...
On February 2, connectivity was re-established by the four main Egyptian service providers. A week later, the heavy filtering that occurred at the height of the revolution had ended and bloggers and online activists who had been arrested were released." [Internet in Egypt. Wikipedia]
The example "Egypt timeline of communication shutdown during jan 25 revolution" was created using the ConceptDraw PRO diagramming and vector drawing software extended with the Typography Infographics solition from the area "What is infographics" in ConceptDraw Solution Park.
Infographics
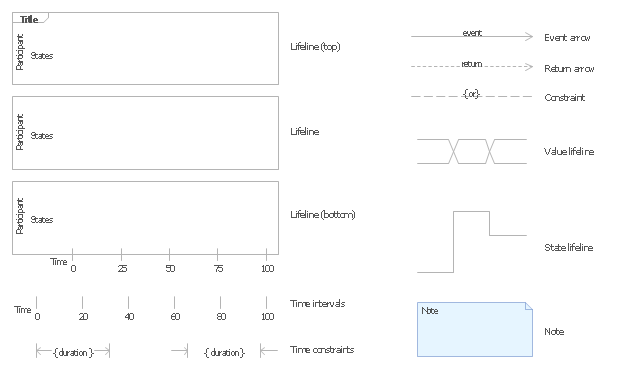
The vector stencils library "UML timing diagrams" contains 15 symbols for the ConceptDraw PRO diagramming and vector drawing software.
"The following nodes and edges are typically drawn in a UML timing diagram: lifeline, state or condition timeline, destruction event, duration constraint, time constraint. ...
Lifeline is a named element which represents an individual participant in the interaction. ... lifelines represent only one interacting entity. ...
Lifeline on the timing diagrams is represented by the name of classifier or the instance it represents. It could be placed inside diagram frame or a "swimlane". ...
Timing diagram could show states of the participating classifier or attribute, or some testable conditions, such as a discrete or enumerable value of an attribute. ...
UML also allows the state/ condition dimension be continuous. It could be used in scenarios where entities undergo continuous state changes, such as temperature or density. ...
Destruction occurrence is a message occurrence which represents the destruction of the instance described by the lifeline. It may result in the subsequent destruction of other objects that this object owns by composition. No other occurrence may appear after the destruction event on a given lifeline.
Complete UML name of the occurrence is destruction occurrence specification. Until UML 2.4 it was called destruction event, and earlier - stop.
The destruction event is depicted by a cross in the form of an X at the end of a timeline. ...
Duration constraint is an interval constraint that refers to a duration interval. The duration interval is duration used to determine whether the constraint is satisfied.
The semantics of a duration constraint is inherited from constraints. If constraints are violated, traces become negative which means that system is considered as failed.
Duration constraint is shown as some graphical association between a duration interval and the constructs that it constrains. ...
Time constraint is an interval constraint that refers to a time interval. The time interval is time expression used to determine whether the constraint is satisfied.
The semantics of a time constraint is inherited from constraints. All traces where the constraints are violated are negative traces, i.e., if they occur, the system is considered as failed.
Time constraint is shown as graphical association between a time interval and the construct that it constrains. Typically this graphical association is a small line, e.g., between an occurrence specification and a time interval." [uml-diagrams.org/ timing-diagrams.html]
The example "Design elements - UML timing diagrams" is included in the Rapid UML solution from the Software Development area of ConceptDraw Solution Park.
UML timing diagram symbols
How to Report Task's Execution with Gantt Chart

Gantt Chart Software

- How to Create a Timeline Diagram in ConceptDraw PRO | Timeline ...
- Timeline Diagrams | How to Create a Timeline Diagram in ...
- Timeline Examples | How to Create a Timeline Diagram in ...
- How to Create a Timeline Diagram in ConceptDraw PRO | How to ...
- How to Make a Timeline | How to Create a Timeline Diagram in ...
- How to Create a Timeline Diagram in ConceptDraw PRO | Timeline ...
- Timeline Examples | Timeline Diagrams | How to Create a Timeline ...
- Timeline Diagrams | Timeline Examples | Timeline Diagrams ...
- Project Timeline | Timeline Diagrams | Timeline Examples | Project ...
- Timeline diagram | How to Create a Timeline Diagram in ...
- How to Create a Timeline Diagram in ConceptDraw PRO | Project ...
- How to Make a Timeline | Timeline Diagrams | Project Timeline ...
- Timeline Diagrams | Business diagrams & Org Charts with ...
- Timeline Diagrams | Timeline Diagrams | Area Charts | Sample Of A ...
- Project timeline diagram - New business project plan | Business ...
- Project plan timeline - Request for proposal (RFP) | Timeline ...
- Timeline Diagrams
- How to Make a Timeline | Timeline Diagrams | How to Create a ...
- Business Diagram Software | Business Process Diagram ...
- Timeline Diagrams | Timeline diagram template | Project timeline ...