"At the base of the identity of an organisational is its organizational culture. A culture is comprised of the shared values, customs, traditions, rituals, behaviours and beliefs shared by a social group (national, ethnic, organizational, etc.). Cultures also share languages, or ways of speaking. From a communication perspective, cultures are made and remade through the words we use to describe our world. Culture represents a common set of values (“shared meanings”), shared by members of a population, a organization, a project/ programme purpose unit or a profession (e.g., engineers versus scientists). Culture change with the times but the speed at which the culture of different institutions change varies widely." [Development Cooperation Handbook/ The development aid organization/ Organizational Culture. Wikibooks]
This organizational culture triangle diagram example derived from Parker and Benson's model. It's for explaination of the Regatta: Adoption Method.
The pyramid diagram example "Organizational culture" was redesigned using the ConceptDraw PRO diagramming and vector drawing software from Wikimedia Commons file Organization_ Triangle.png. [commons.wikimedia.org/ wiki/ File:Organization_ Triangle.png]
This file is licensed under the Creative Commons Attribution-Share Alike 2.5 Generic license. [creativecommons.org/ licenses/ by-sa/ 2.5/ deed.en]
The triangular chart sample "Organizational culture" is included in the Pyramid Diagrams solution from the Marketing area of ConceptDraw Solution Park.
Pyramid diagram

Pyramid Diagram

Matrix Organization Structure

Total Quality Management Business Diagram

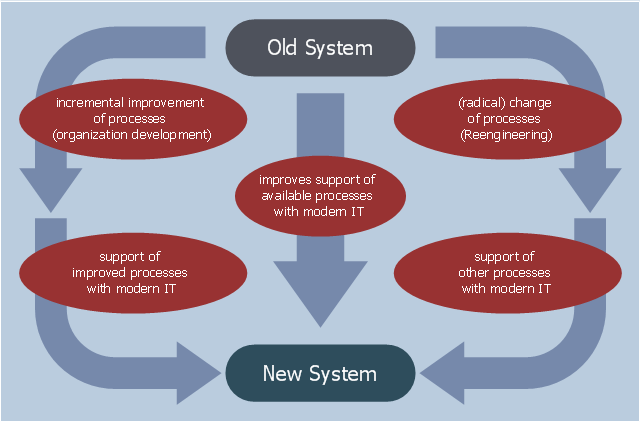
This example was designed on the base of the diagram "Organization Development vs. Business Process Reengineering" from the website of the Computer Science, Faculty 3, Bremen University. [informatik.uni-bremen.de/ gdpa/ part3/ p3gpo.htm]
"The efforts, behaviour, and performance of an employee in any organization for their growth is known as Organization development(OD).
Organization development (OD) is a field of research, theory and practice dedicated to expanding the knowledge and effectiveness of people to accomplish more successful organizational change and performance. ...
Key concepts of OD theory include: organizational climate (the mood or unique “personality” of an organization, which includes attitudes and beliefs that influence members’ collective behavior), organizational culture (the deeply-seated norms, values and behaviors that members share) and organizational strategies (how an organization identifies problems, plans action, negotiates change and evaluates progress)." [Organization development. Wikipedia]
The workflow diagram example "Organization Development vs. Business Process Reengineering" was created using ConceptDraw PRO software extended with the Business Process Workflow Diagrams solution from the Business Processes area of ConceptDraw Solution Park.
Workflow diagram
Deployment Chart Software

How to Draw an Organization Chart

Value Stream Mapping Symbols

Pyramid Diagram

Pyramid Diagram

- Organizational culture - Triangle diagram | Block diagram - Types of ...
- Organizational culture - Triangle diagram | Pyramid Diagram ...
- Organizational culture - Triangle diagram | ConceptDraw Arrows10 ...
- Pyramid Diagram | Organizational culture - Triangle diagram | Using ...
- Organizational culture - Triangle diagram | 4 Level pyramid model ...
- Organizational culture - Triangle diagram | Organisational Triangle
- Pyramid Diagram | Pyramid Diagram | Organizational culture ...
- Organisational Culture Flow Chart Diagram
- Business Process Workflow Diagrams | Organizational culture ...
- Organizational culture - Triangle diagram | How to Draw a Matrix ...