Sales Growth. Bar Graphs Example

Waterfall Bar Chart

Growth-Share Matrix Software

Basic Diagramming


Pyramid Diagram

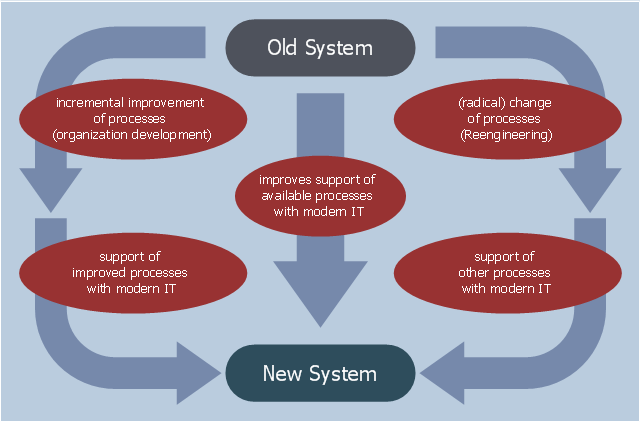
This example was designed on the base of the diagram "Organization Development vs. Business Process Reengineering" from the website of the Computer Science, Faculty 3, Bremen University. [informatik.uni-bremen.de/ gdpa/ part3/ p3gpo.htm]
"The efforts, behaviour, and performance of an employee in any organization for their growth is known as Organization development(OD).
Organization development (OD) is a field of research, theory and practice dedicated to expanding the knowledge and effectiveness of people to accomplish more successful organizational change and performance. ...
Key concepts of OD theory include: organizational climate (the mood or unique “personality” of an organization, which includes attitudes and beliefs that influence members’ collective behavior), organizational culture (the deeply-seated norms, values and behaviors that members share) and organizational strategies (how an organization identifies problems, plans action, negotiates change and evaluates progress)." [Organization development. Wikipedia]
The workflow diagram example "Organization Development vs. Business Process Reengineering" was created using ConceptDraw PRO software extended with the Business Process Workflow Diagrams solution from the Business Processes area of ConceptDraw Solution Park.
Workflow diagram
Percentage Pie Chart. Pie Chart Examples

The Building Blocks Used in EPC Diagrams
")
Bar Diagrams for Problem Solving. Create event management bar charts with Bar Graphs Solution

Column Chart Examples

- Venn Diagram Of Growth And Development
- Vienn Diagram Of Growth And Development
- Flow Chart About Human Growth And Development
- Sales Growth . Bar Graphs Example | Bar Diagrams for Problem ...
- Bar Diagrams for Problem Solving. Create event management bar ...
- Venn Diagram In Community Development
- Principle On Human Development In Venn Diagram
- Sales Growth . Bar Graphs Example | Bar Diagrams for Problem ...
- Path to sustainable development | Venn Diagram Examples for ...
- Venn Diagram Examples for Problem Solving. Environmental Social ...