"Ecosystems represent sources of natural capital and provide goods and services to society, also called ecosystem services. The Millennium Ecosystem Assessment identified over 24 ecosystem services that can be divided up into 4 general groups including: 1) provisioning, 2) supporting, 3) regulating and 4) cultural." [User:Sawtoothgirl/ Sustainable Real Estate Development. Wikipedia]
"Humankind benefits in a multitude of ways from ecosystems. Collectively, these benefits are known as ecosystem services. Ecosystem services are regularly involved in the provisioning of clean drinking water and the decomposition of wastes. While scientists and environmentalists have discussed ecosystem services implicitly for decades, these the ecosystem services concept itself was popularized by the Millennium Ecosystem Assessment (MA) in the early 2000s. This grouped ecosystem services into four broad categories: provisioning, such as the production of food and water; regulating, such as the control of climate and disease; supporting, such as nutrient cycles and crop pollination; and cultural, such as spiritual and recreational benefits. To help inform decision-makers, many ecosystem services are being assigned economic values." [Ecosystem services. Wikipedia]
The segmented pyramid diagram example "Ecosystem goods and services" was redesigned using the ConceptDraw PRO diagramming and vector drawing software from Wikimedia Commons file ES_ triangle.png.
[commons.wikimedia.org/ wiki/ File:ES_ triangle.png]
This file is licensed under the Creative Commons Attribution-Share Alike 3.0 Unported license. [creativecommons.org/ licenses/ by-sa/ 3.0/ deed.en]
This segmented pyramid diagram example "Ecosystem goods and services" is included in the Pyramid Diagrams solution from the Marketing area of ConceptDraw Solution Park.
Pyramid diagram

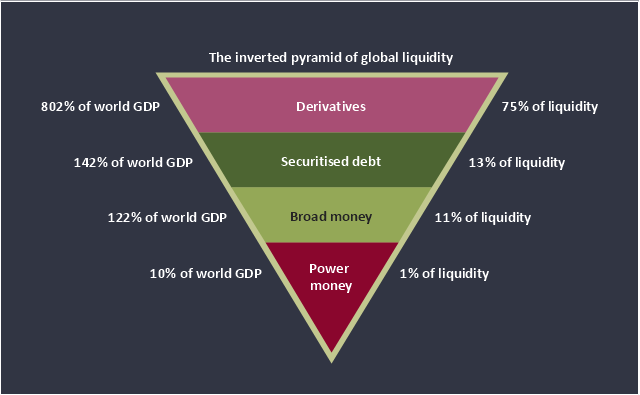
This inverted pyramid diagram of global liquidity shows world GDP and liquidity for 4 levels: derivatives, securitised debt, broad money, and power money.
"In business, economics or investment, market liquidity is a market's ability to facilitate an asset being sold quickly without having to reduce its price very much (or even at all). Equivalently, an asset's market liquidity (or simply "an asset's liquidity") is the asset's ability to sell quickly without having to reduce its price very much. Liquidity is about how big the trade-off is between the speed of the sale and the price it can be sold for. In a liquid market, the trade-off is mild: selling quickly will not reduce the price much. In a relatively illiquid market, selling it quickly will require cutting its price by some amount.
Money, or cash, is the most liquid asset, because it can be "sold" for goods and services instantly with no loss of value. There is no wait for a suitable buyer of the cash. There is no trade-off between speed and value. It can be used immediately to perform economic actions like buying, selling, or paying debt, meeting immediate wants and needs.
If an asset is moderately (or very) liquid, it has moderate (or high) liquidity. In an alternative definition, liquidity can mean the amount of highly liquid assets. If a business has moderate liquidity, it has a moderate amount of very liquid assets. If a business has sufficient liquidity, it has a sufficient amount of very liquid assets and the ability to meet its payment obligations." [Market liquidity. Wikipedia]
This inverted triangle diagram was redesigned using the ConceptDraw PRO diagramming and vector drawing software from Wikimedia Commons file The inverted pyramid of global liquidity.gif. [commons.wikimedia.org/ wiki/ File:The_ inverted_ pyramid_ of_ global_ liquidity.gif]
This triangular chart example is included in the Pyramid Diagrams solution from the Marketing area of ConceptDraw Solution Park.
Inverted pyramid diagram
Pyramid Diagram

Diagram of a Pyramid

Control and Information Architecture Diagrams (CIAD) with ConceptDraw PRO

Business Report Pie. Pie Chart Examples

Online Collaboration via Skype


Venn Diagram Examples for Problem Solving

Types of Flowcharts


Competitor Analysis

Sales Growth. Bar Graphs Example

- Pyramid Diagram | Global liquidity inverted pyramid diagram ...
- Pyramid Diagram | Purchase funnel diagram | Funnel diagram ...
- Pyramid Diagram
- Global liquidity inverted pyramid diagram | Purchase Process Flow ...
- Diagram Draw Marketing And Selling
- Service-goods continuum diagram | Pyramid Chart Examples ...
- Market value - Pyramid diagram | Circle-spoke diagram - Target ...
- Venn Diagram | Pyramid Chart Examples | Ecosystem goods and ...
- Pyramid Chart Examples | Pyramid Diagram | Priority pyramid ...
- Pyramid Diagram | 3 Level pyramid model diagram - Information ...
- Global liquidity inverted pyramid diagram | Business and Finance ...
- 3D Network Diagram Software | Pyramid Diagram | Examples of ...
- How to Make an Ansoff Matrix Template in ConceptDraw PRO ...
- Ecosystem goods and services - Segmented pyramid diagram ...
- PROBLEM ANALYSIS. Prioritization Matrix | PROBLEM ANALYSIS ...
- Pyramid Chart Examples | Pyramid Diagram and Pyramid Chart ...
- Pyramid Chart Examples | Pyramid Diagram | Pyramid Diagram ...
- Pyramid Diagram | Examples of Flowcharts, Org Charts and More ...
- Service-goods continuum diagram | Ecosystem goods and services ...
- How to Create a Pyramid Diagram | How to Draw a Pyramid ...