This site uses cookies. By continuing to browse the ConceptDraw site you are agreeing to our Use of Site Cookies.

Example of DFD for Online Store (Data Flow Diagram)

Data flow diagrams (DFDs) reveal relationships among and between the various components in a program or system. DFDs are an important technique for modeling a system’s high-level detail by showing how input data is transformed to output results through a sequence of functional transformations.
Example of DFD for Online Store shows the Data Flow Diagram for online store and interactions between the Visitors, Customers and Sellers, as well as Website Information and User databases.
Steps to Creating a Sales Process Flow Chart

Sales Process Flowchart. Flowchart Examples

Create your own flow charts of sales business processes using the ConceptDraw DIAGRAM diagramming and vector drawing software extended with the Cross-Functional Flowcharts solution from the Business Processes area or Sales Flowcharts from the Marketing area of ConceptDraw Solution Park.

UML Use Case Diagram Example. Social Networking Sites Project

UML Diagrams Social Networking Sites Project. This sample was created in ConceptDraw DIAGRAM diagramming and vector drawing software using the UML Use Case Diagram library of the Rapid UML Solution from the Software Development area of ConceptDraw Solution Park.
This sample shows the Facebook Socio-health system and is used at the projection and creating of the social networking sites.

sales funnel, funnel, business funnel, funnel chart, funnel diagram, funnel management, lead funnel, marketing and sales funnel, marketing sales funnel, sales funnel examples, sales funnel stages Funnel Diagrams

sales funnel, funnel, business funnel, funnel chart, funnel diagram, funnel management, lead funnel, marketing and sales funnel, marketing sales funnel, sales funnel examples, sales funnel stages
Funnel Diagrams solution including wide range of funnel diagram samples, sales funnel examples, and vector design elements, makes the ConceptDraw DIAGRAM ideal for funnel management and creation the Funnel Diagrams of different types and designs, AIDA Model, AIDAS, ACCA Dagmar, Rossiter-Percy Model, Sales funnel, Marketing funnel, Search funnel, Brand funnel, Purchase funnel, Lead funnel, Conversion funnel, Business funnel, etc. You are free to choose to place your funnel object horizontally or vertically, you can use the objects with desired quantity of sales funnel stages, as well as to modify their size, color filling, and other parameters to make exceptionally looking Funnel diagrams fully responding to your desires.

Fishbone Diagram Problem Solving

The Ishikawa diagram, Cause and Effect diagram, Fishbone diagram — all they are the names of one and the same visual method for working with causal connections. Originally invented by Kaoru Ishikawa to control the process quality, the Ishikawa diagram is well proven in other fields of management and personal scheduling, events planning, time management. It is a chart in the form of a fish, whose head is a problem, the fins are variants for its causes.
To design easily the Fishbone diagram, you can use a special ConceptDraw DIAGRAM vector graphic and diagramming software which contains the powerful tools for Fishbone diagram problem solving offered by Fishbone Diagrams solution for the Management area of ConceptDraw Solution Park.

Material Requisition Flowchart. Flowchart Examples

Create your own material requisition flow charts using the ConceptDraw DIAGRAM diagramming and vector drawing software extended with the Flowcharts solution from the Diagrams area of ConceptDraw Solution Park.
The flowchart example shows the material requisition business process.

Geo Map - USA - Illinois

Illinois is a state in the Midwestern United States. It is the 5th most populous and 25th most extensive state, and is often noted as a microcosm of the entire country.
The vector stencils library Illinois contains contours for ConceptDraw DIAGRAM diagramming and vector drawing software. This library is contained in the Continent Maps solution from Maps area of ConceptDraw Solution Park.

marketing diagram, marketing chart Marketing Diagrams

marketing diagram, marketing chart
Marketing Diagrams solution extends ConceptDraw DIAGRAM diagramming software with abundance of samples, templates and vector design elements intended for easy graphical visualization and drawing different types of Marketing diagrams and graphs, including Branding Strategies Diagram, Five Forces Model Diagram, Decision Tree Diagram, Puzzle Diagram, Step Diagram, Process Chart, Strategy Map, Funnel Diagram, Value Chain Diagram, Ladder of Customer Loyalty Diagram, Leaky Bucket Diagram, Promotional Mix Diagram, Service-Goods Continuum Diagram, Six Markets Model Diagram, Sources of Customer Satisfaction Diagram, etc. Analyze effectively the marketing activity of your company and apply the optimal marketing methods with ConceptDraw DIAGRAM software.

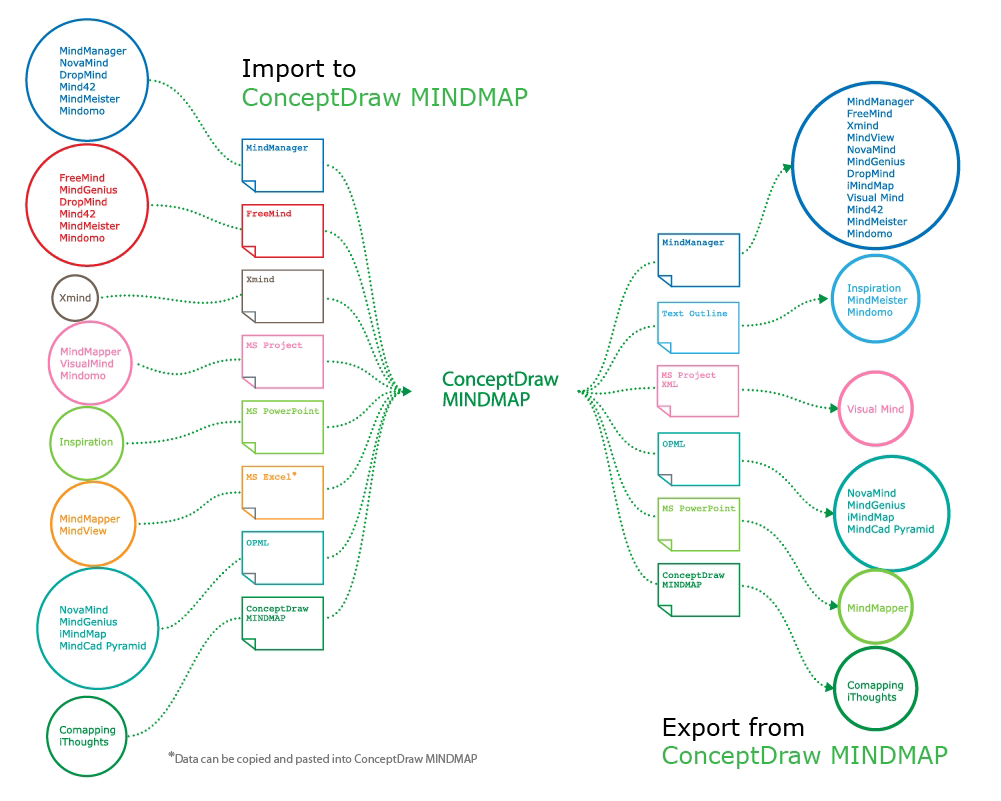
How to Exchange ConceptDraw MINDMAP Files with Mindjet MindManager

ConceptDraw MINDMAP has impressive import and export capabilities includes following formats:

OPML
Mindjet™ MindManager™
Microsoft™ Office products:
PowerPoint™
Project™
Word™
FreeMind (import only)
XMind (import only)
How to exchange ConceptDraw MINDMAP Files with Mindjet Mindmanager