HelpDesk
How to Create a Bank ATM Use Case Diagram

UML Use Case Diagram Example. Services UML Diagram. ATM system

UML Diagram

UML Deployment Diagram Example - ATM System UML diagrams

 Event-driven Process Chain Diagrams
Event-Driven Process Chain Diagrams solution extends ConceptDraw DIAGRAM functionality with event driven process chain templates, samples of EPC engineering and modeling the business processes, and a vector shape library for drawing the EPC diagrams and EPC flowcharts of any complexity. It is one of EPC IT solutions that assist the marketing experts, business specialists, engineers, educators and researchers in resources planning and improving the business processes using the EPC flowchart or EPC diagram. Use the EPC solutions tools to construct the chain of events and functions, to illustrate the structure of a business process control flow, to describe people and tasks for execution the business processes, to identify the inefficient businesses processes and measures required to make them efficient.
Diagramming Software for Design UML Activity Diagrams


 Entity-Relationship Diagram (ERD)
Entity-Relationship Diagram (ERD) solution extends ConceptDraw DIAGRAM software with templates, samples and libraries of vector stencils from drawing the ER-diagrams by Chen's and crow’s foot notations.
 Data Flow Diagrams (DFD)
Data Flow Diagrams solution extends ConceptDraw DIAGRAM software with templates, samples and libraries of vector stencils for drawing the data flow diagrams (DFD).
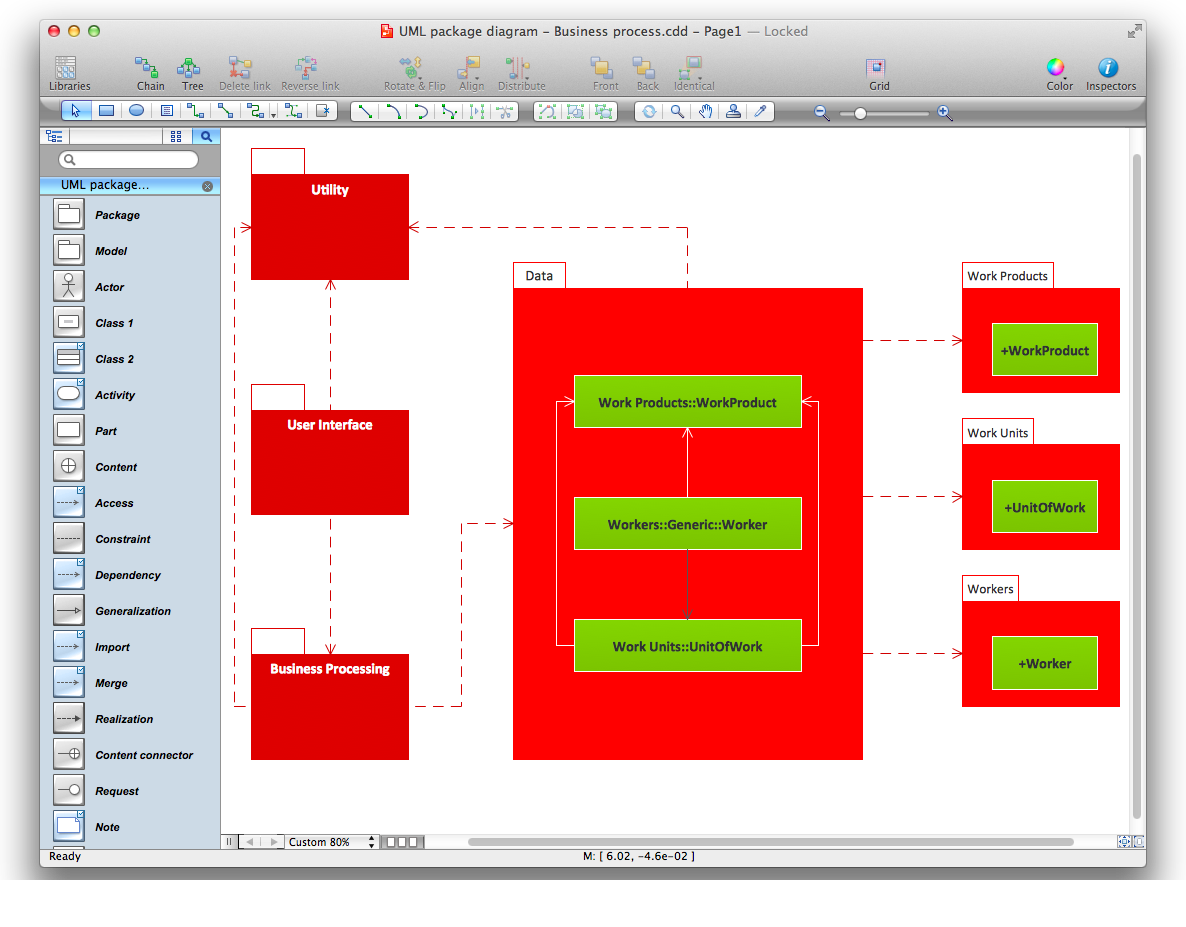
Diagramming Software for Design UML Package Diagrams
 Entity-Relationship Diagram (ERD)
An Entity-Relationship Diagram (ERD) is a visual presentation of entities and relationships. That type of diagrams is often used in the semi-structured or unstructured data in databases and information systems. At first glance ERD is similar to a flowch
 Business Process Diagrams
Business Process Diagrams solution extends the ConceptDraw DIAGRAM BPM software with RapidDraw interface, templates, samples and numerous libraries based on the BPMN 1.2 and BPMN 2.0 standards, which give you the possibility to visualize equally easy simple and complex processes, to design business models, to quickly develop and document in details any business processes on the stages of project’s planning and implementation.
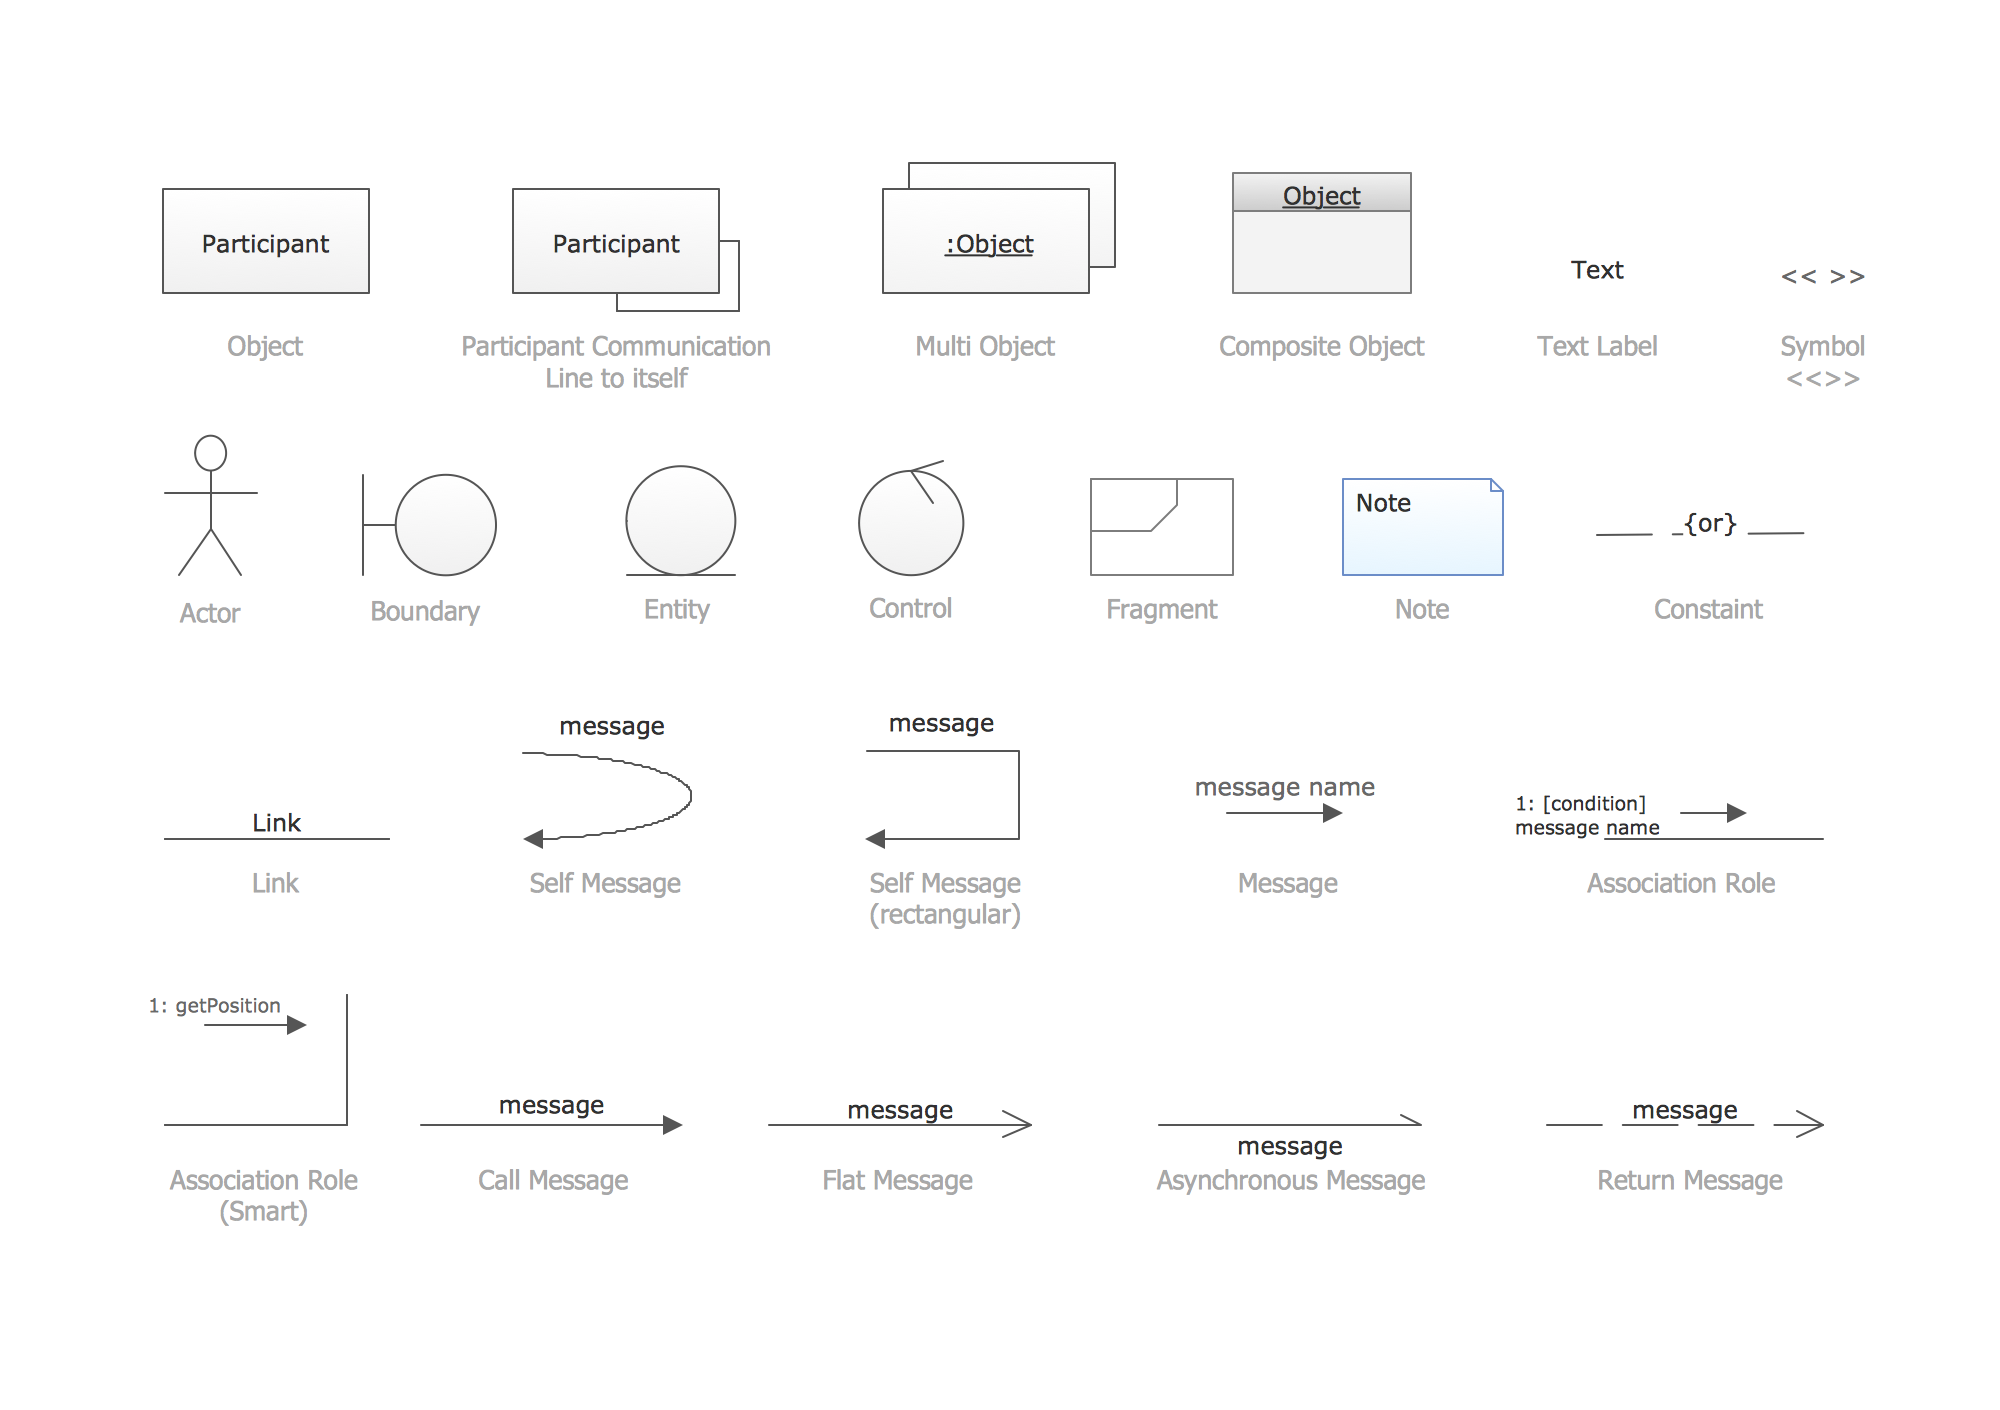
UML Collaboration Diagram. Design Elements
 Computer Network Diagrams
Computer Network Diagrams solution extends ConceptDraw DIAGRAM software with samples, templates and libraries of vector icons and objects of computer network devices and network components to help you create professional-looking Computer Network Diagrams, to plan simple home networks and complex computer network configurations for large buildings, to represent their schemes in a comprehensible graphical view, to document computer networks configurations, to depict the interactions between network's components, the used protocols and topologies, to represent physical and logical network structures, to compare visually different topologies and to depict their combinations, to represent in details the network structure with help of schemes, to study and analyze the network configurations, to communicate effectively to engineers, stakeholders and end-users, to track network working and troubleshoot, if necessary.
 Enterprise Architecture Diagrams
Enterprise Architecture Diagrams solution extends ConceptDraw DIAGRAM software with templates, samples and library of vector stencils for drawing the diagrams of enterprise architecture models.
 Fishbone Diagram
Fishbone Diagrams solution extends ConceptDraw DIAGRAM software with templates, samples and library of vector stencils for drawing the Ishikawa diagrams for cause and effect analysis.
- Design And Develop Use Case Diagram And Activity Diagram For
- UML activity diagram - Cash withdrawal from ATM | UML Activity ...
- Bank Activity Diagram
- UML activity diagram - Cash withdrawal from ATM | UML Activity ...
- UML Deployment Diagram Example - ATM System UML diagrams ...
- UML Activity Diagram | Diagramming Software for Design UML ...
- UML activity diagram - Cash withdrawal from ATM | UML ...
- UML use case diagram - Banking system
- UML Diagram | Bank UML Diagram | ATM UML Diagrams | Package ...
- Determine groundwater - IDEF0 diagram | Automated payroll ...
- ATM Solutions | Design elements - Bank UML activity diagram ...
- Www Develop Class Diagram For Atm Pdf Com
- UML Activity Diagram | UML Deployment Diagram Example - ATM ...
- Package Diagram With Example In Banking System Model
- Develop Interaction Diagram For Atm
- Banking System | Data Flow Diagrams (DFD) | Bank System | Activity ...
- UML activity diagram - Cash withdrawal from ATM | Global Payment ...
- Cross-Functional Flowchart (Swim Lanes) | Swim Lane Diagrams ...
- UML use case diagram - Banking system | How to Create a Bank ...
- UML Deployment Diagram Example - ATM System UML diagrams ...