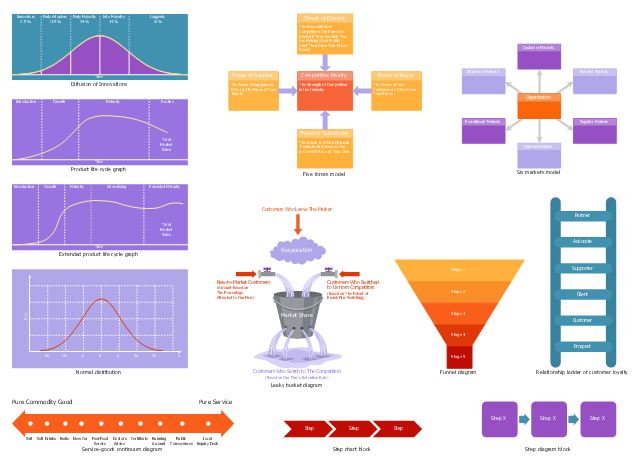
The vector stencils library Marketing diagrams contains 9 templates: Diffusion of innovations diagram, Product life cycle graph, Extended product life cycle graph, Normal distribution chart, Service-goods continuum diagram, Relationship ladder of customer loyalty diagram, Leaky bucket diagram, Six markets model, Five forces model.
Use the design elements library "Marketing diagrams" to illustrate your business documents, presentation slides and infographics, corporate websites and blogs using the ConceptDraw PRO diagramming and vector drawing software.
The example "Design elements - Marketing diagrams" is included in the Marketing Diagrams solution from the Marketing area of ConceptDraw Solution Park.
Marketing diagram and graph templates
The vector stencils library "Marketing charts" contains 12 graphs and charts: area chart, column chart, divided bar diagram, histogram, horizontal bar graph, line graph, pie chart, ring chart, scatter plot.
Use it to create your marketing infograms.
"A chart can take a large variety of forms, however there are common features that provide the chart with its ability to extract meaning from data.
Typically the data in a chart is represented graphically, since humans are generally able to infer meaning from pictures quicker than from text. Text is generally used only to annotate the data.
One of the more important uses of text in a graph is the title. A graph's title usually appears above the main graphic and provides a succinct description of what the data in the graph refers to.
Dimensions in the data are often displayed on axes. If a horizontal and a vertical axis are used, they are usually referred to as the x-axis and y-axis respectively. Each axis will have a scale, denoted by periodic graduations and usually accompanied by numerical or categorical indications. Each axis will typically also have a label displayed outside or beside it, briefly describing the dimension represented. If the scale is numerical, the label will often be suffixed with the unit of that scale in parentheses. ...
The data of a chart can appear in all manner of formats, and may include individual textual labels describing the datum associated with the indicated position in the chart. The data may appear as dots or shapes, connected or unconnected, and in any combination of colors and patterns. Inferences or points of interest can be overlaid directly on the graph to further aid information extraction.
When the data appearing in a chart contains multiple variables, the chart may include a legend (also known as a key). A legend contains a list of the variables appearing in the chart and an example of their appearance. This information allows the data from each variable to be identified in the chart." [Chart. Wikipedia]
The shapes example "Design elements - Marketing charts" was created using the ConceptDraw PRO diagramming and vector drawing software extended with the Marketing Infographics solition from the area "Business Infographics" in ConceptDraw Solution Park.
Graphs and charts

 Marketing Diagrams
This solution extends ConceptDraw PRO with samples, templates and library of design elements for drawing the marketing diagrams.
Marketing Plan Infographic

Marketing Flow Chart

Market Chart

Marketing Organization Chart

Marketing - Design Elements

Marketing Charts

Target Diagram

Pyramid Charts

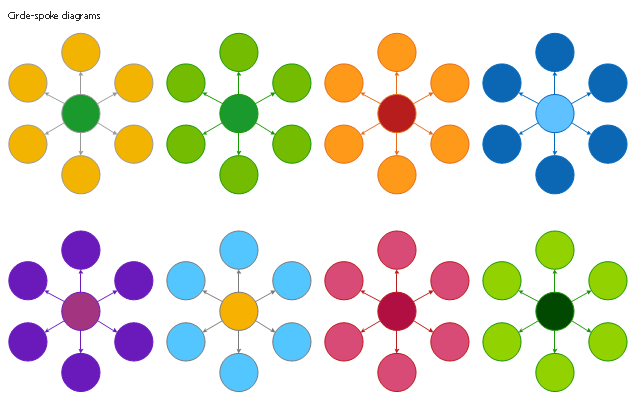
The vector stencils library "Circle-spoke diagram" contains 8 templates for the ConceptDraw PRO diagramming and vector drawing software.
Circle-Spoke Diagrams (Spoke charts) have a central item surrounded by other items in a circle. The circle-spoke diagram is a diagram meant to illustrate that each spoke has equal value. Circle-spoke diagrams are used to show the relationships between a single main element and several satellites.
The circle-spoke diagrams are used to show the features or components of a central item in marketing, management documents and presentations.
The example "Design elements - Circle-spoke diagram" is included in the Circle-Spoke Diagrams solution from the area "What is a Diagram" of ConceptDraw Solution Park.
Circle spoke diagram templates
Daily Schedule Chart

 SYSML
SYSML
The SysML solution helps to present diagrams using Systems Modeling Language; a perfect tool for system engineering.
 ATM UML Diagrams
The ATM UML Diagrams solution lets you create ATM solutions and UML examples. Use ConceptDraw PRO as a UML diagram creator to visualize a banking system.
Energy Pyramid Diagram

Circular Diagram

 ConceptDraw Solution Park
ConceptDraw Solution Park collects graphic extensions, examples and learning materials
- Product life cycle graph template | Design elements - Marketing ...
- Design elements - Marketing diagrams | Marketing Diagrams ...
- Design elements - Marketing diagrams
- Ladder of customer loyalty diagram | Marketing Diagrams | Design ...
- Design elements - Marketing diagrams | Nature | Marketing ...
- Marketing Diagrams | Design elements - Marketing diagrams ...
- Ladder of customer loyalty diagram | Design elements - Marketing ...
- Marketing Charts | Design elements - Marketing charts | Market ...
- Service-goods continuum diagram | Marketing Diagrams | Design ...
- Design elements - Marketing charts | Marketing Analysis Diagram ...
- Product life cycle graph template | Design elements - Marketing ...
- Design elements - Marketing charts | How to Create a Picture Graph ...
- Content marketing cycle - Diamond pie chart | Design elements ...
- Product life cycle graph | Product life cycle graph template | Design
- Product life cycle graph | Good Flow Chart app for Mac | Design ...
- Marketing Diagrams | Marketing | Marketing and Sales Organization ...
- Business and Finance | Office Layout Plans | Marketing Diagrams ...
- Leaky bucket diagram | Marketing diagrams - Vector stencils library ...
- Marketing Diagrams | Marketing Charts | Marketing Organization ...
- Marketing | Internet marketing - Concept map | Design elements ...