The vector stencils library "Audit flowcharts" contains 31 flow chart symbols.
Use it in accounting, financial management, fiscal information tracking, money management, decision making, and financial inventories to create auditing flowchart diagrams in the ConceptDraw PRO diagramming and vector drawing software extended with the Audit Flowcharts solution from the Finance and Accounting area of ConceptDraw Solution Park.
www.conceptdraw.com/ solution-park/ finance-audit-flowcharts
Tagged Process

Tagged Document

Decision

Manual operation

Terminator

Manual File

Display

On-page reference

Off-page reference

Divided (Table View)
-audit-flowcharts---vector-stencils-library.png--diagram-flowchart-example.png)
Process

Lined / shaded process

Lined Document

Document

Database

Disk Storage

Floppy disk

Magnetic Tape

Data Transmission

Manual input

Check 1 (audit)
-audit-flowcharts---vector-stencils-library.png--diagram-flowchart-example.png)
Compare 1

Reference point

Check 2 (audit)
-audit-flowcharts---vector-stencils-library.png--diagram-flowchart-example.png)
Compare 2

Event

Entity (Rounded Corners)
-audit-flowcharts---vector-stencils-library.png--diagram-flowchart-example.png)
Title Block
Condition

Input/ Output

Delay

Software and Database Design with ConceptDraw DIAGRAM

Basic Flowchart Symbols and Meaning


Sales Process Flowchart Symbols

Data Flow Diagram

Data Flow Diagrams

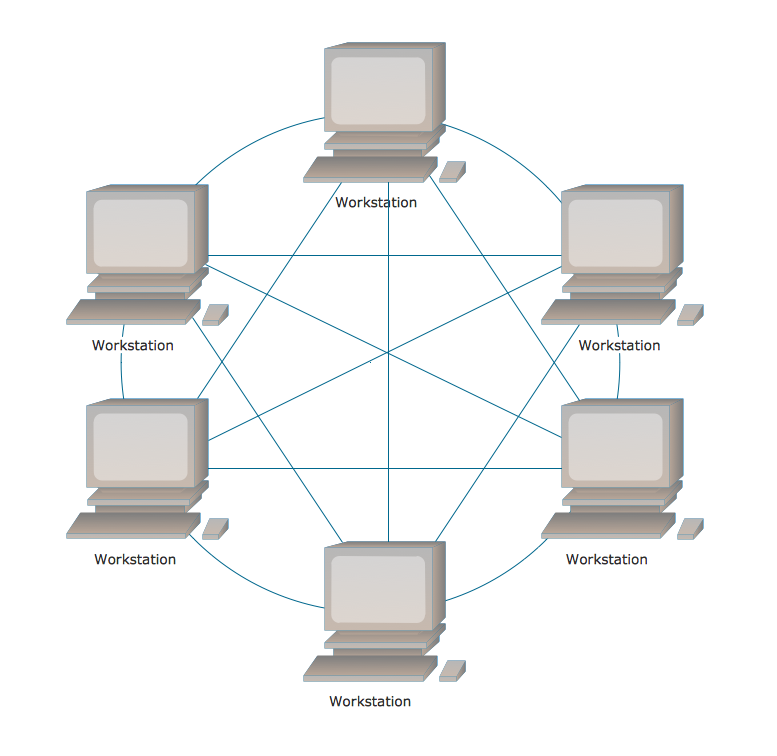
Fully Connected Network Topology Diagram
Audit Flowchart Symbols

Basic Audit Flowchart. Flowchart Examples

Star Network Topology


- Kinds Of Flowchart In Database
- Database Flowchart Audit Process
- Audit Flowcharts | Audit Flowchart Symbols | Basic Audit Flowchart ...
- Audit Flowcharts | Basic Audit Flowchart. Flowchart Examples | Audit ...
- Audit flowcharts - Vector stencils library | Audit flowcharts - Vector ...
- Audit flowcharts - Vector stencils library | Audit process flowchart ...
- Audit flowchart - Project management process | Software Work Flow ...
- Finance Audit Flow
- Currency - Vector stencils library | Post and Mail - Vector stencils ...
- Basic Audit Flowchart. Flowchart Examples | Audit flowchart - Project ...