Performance Indicators
ConceptDraw PRO diagramming and vector drawing software offers the useful tools of the Sales Dashboard solution from the Marketing area for easy creating professional looking live dashboards which allow to track the business sales activity and progress thanks to representing the Key Performance Indicators (KPIs) on them.The Facts and KPIs
Visualizing sales data help you see the facts and KPIs about your sales process to make conclusions and see how your business can improve.Strategy Map
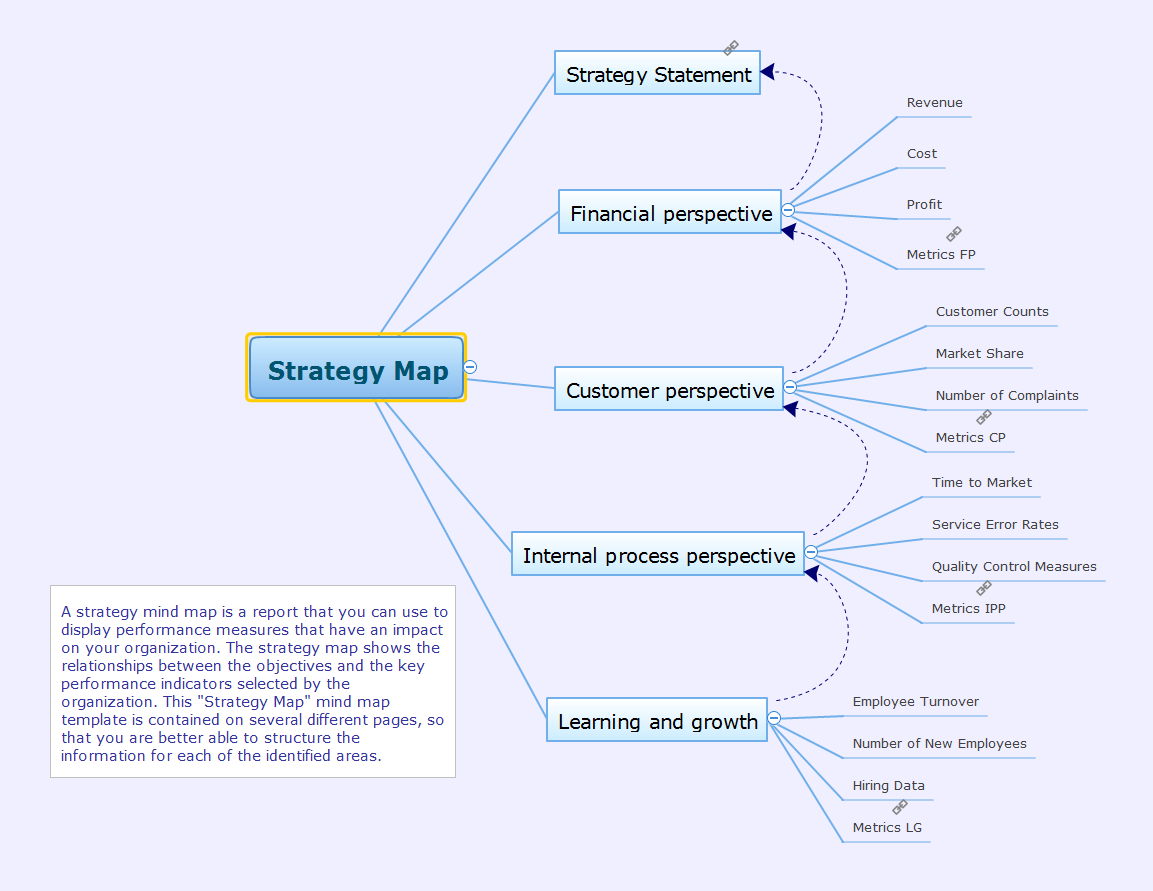
The enterprise strategy is an interrelated perspective plan of actions designed to achieve long-term goals according to company's own potential as well as external factors. Development of strategy is one of the main functions of management. The strategy determines the enterprise's direction of development, it covers all major functions and departments: supply, production, finance, marketing, personnel, scientific researches and development, and helps managers to make informed decisions when choosing a method of actions. The choice by managers of a particular strategy means that of all the possible paths of development and ways of actions, it is decided to choose one direction in which the enterprise will evolve. Without a strategy the administration has no thought-out plan of actions, no guide in the world of business, and no unified program to achieve desired results. Since in the process of strategic decision making always appear new alternatives and is executed the search of the most preferred solutions, the initially designated goals of strategic development can be subsequently adjusted. This Mind Map template of a strategy map helps to display a variety of performance measures, which can have an impact on your organization.
 Meter Dashboard
Meter dashboard solution extends ConceptDraw PRO software with templates, samples and vector stencils library with meter indicators for drawing visual dashboards showing quantitative data.
Financial Comparison Chart
This sample shows the Bar Chart of the leverage ratios for two major investment banks. The leverage ratio is the ratio of the total debt to the total equity; it is a measure of the risk taken by the bank. The higher of the leverage ratio denotes the more risk, the greater risks can lead to the subprime crisis.TQM Diagram — Professional Total Quality Management
The Total Quality Management Diagram solution helps you and your organization visualize business and industrial processes. Create Total Quality Management diagrams for business process with ConceptDraw software.- Performance Indicators | The Facts and KPIs | KPIs and Metrics ...
- KPIs and Metrics | Sales metrics and KPIs - Visual dashboard | Meter ...
- KPIs and Metrics | Cross-functional flowchart Templates portrait ...
- Cafe performance metrics vs. air temperature - Visual dashboard ...
- Sample Of Kpi Template
- KPIs and Metrics | Business Intelligence Dashboard | Competitor ...
- Hr Metrics Dashboard Example
- Key Performance Indicators Templates
- KPIs and Metrics | Data Visualization Software Solutions | Sales KPI ...
- KPIs and Metrics | KPI Dashboard | The Facts and KPIs | Kpis
- KPIs and Metrics | The Facts and KPIs | Sales Dashboards for Your ...
- Website metrics - Visual dashboard | Website traffic dashboard ...
- Performance Indicators Examples
- Design elements - Meter indicators | Meter Dashboard | Sales ...
- Performance Indicators | Design elements - Composition charts and ...
- Website traffic dashboard | Website metrics - Visual dashboard ...
- KPI Dashboard | Enterprise dashboard | Visualize Sales Data Using ...
- KPIs and Metrics | Business Intelligence Dashboard | Website ...
- Performance Indicators | PM Dashboards | Design elements - Sales ...
- KPI Dashboard | What is a KPI? | Sales KPI Dashboards | Ppt ...


