This site uses cookies. By continuing to browse the ConceptDraw site you are agreeing to our Use of Site Cookies.

Process Flowchart

The main reason of using Process Flowchart or PFD is to show relations between major parts of the system. Process Flowcharts are used in process engineering and chemical industry where there is a requirement of depicting relationships between major components only and not include minor parts. Process Flowcharts for single unit or multiple units differ in their structure and implementation. ConceptDraw DIAGRAM is Professional business process mapping software for making Process flowcharts, Process flow diagram, Workflow diagram, flowcharts and technical illustrations for business documents and also comprehensive visio for mac application. Easier define and document basic work and data flows, financial, production and quality management processes to increase efficiency of your business with ConcepDraw DIAGRAM. Business process mapping software with Flowchart Maker ConceptDraw DIAGRAM includes extensive drawing tools, rich examples and templates, process flowchart symbols and shape libraries, smart connectors that allow you create the flowcharts of complex processes, process flow diagrams, procedures and information exchange. Process Flowchart Solution is project management workflow tools which is part ConceptDraw Project marketing project management software. Drawing charts, diagrams, and network layouts has long been the monopoly of Microsoft Visio, making Mac users to struggle when needing such visio alternative like visio for mac, it requires only to view features, make a minor edit to, or print a diagram or chart. Thankfully to MS Visio alternative like ConceptDraw DIAGRAM software, this is cross-platform charting and business process management tool, now visio alternative for making sort of visio diagram is not a problem anymore however many people still name it business process visio tools.
How To Create a Process Flow Chart (business process modelling techniques)

Data Flow Diagrams

Data Flow Diagram (DFD) is a special chart type which lets graphically illustrate the "flow" of data through an information system. So the Data Flow Diagrams can be successfully used for visualization of data processing or structured design, for creation an overview of the system, for business process modeling, for exploring the high-level design in terms of data flows and documenting the major data flows. Inclusion of powerful Data Flow Diagrams solution to the Software Development area of ConceptDraw Solution Park makes the ConceptDraw DIAGRAM a beneficial data flow diagramming software and supplies it with numerous collection of quick-start templates, professionaly designed samples, and extensive range of ready-for-use vector objects consisting the Data Flow Diagrams, Gane-Sarson Notation, and Yourdon and Coad Notation libraries. Use the ConceptDraw DIAGRAM application to design easy and quickly the Data Flow Diagrams including the data storages, data flows, external entities, functional transforms, control transforms and signals.

data flow diagram, DFD templates Data Flow Diagrams (DFD)

data flow diagram, DFD templates
Data Flow Diagrams solution extends ConceptDraw DIAGRAM software with templates, samples and libraries of vector stencils for drawing the data flow diagrams (DFD).

Entity Relationship Diagram - ERD - Software for Design Crows Foot ER Diagrams

ER-model is a data model which lets describe the conceptual schemes in a specific subject area. It can help to highlight the key entities and specify relationships that can be established between these entities. During the database design, it is realized the transformation of ER model into certain database scheme based on the chosen data model (relational, object, network, etc.). There are used two notations for ERDs: Crow's Foot and Chen's. Crow's Foot notation proposed by Gordon Everest represents the entity by rectangle containing its name (name must be unique within this model), and relation - by the line which links two entities involved in relationship. The relationship's plurality is graphically indicated by a "plug" on the end of the link, the optionality - by a circle. Entity-Relationship Diagrams based on Crow's Foot notation can be easily drawn using the ConceptDraw DIAGRAM. Extended with Entity-Relationship Diagram (ERD) solution, it is the best ERD diagrams software with powerful tools and ready design elements for Crow's Foot and Chen notations.
How to Build an Entity Relationship Diagram (ERD)

Basic Flowchart Symbols and Meaning

Flowcharts are the best for visually representation the business processes and the flow of a custom-order process through various departments within an organization. ConceptDraw DIAGRAM diagramming and vector drawing software extended with Flowcharts solution offers the full set of predesigned basic flowchart symbols which are gathered at two libraries: Flowchart and Flowcharts Rapid Draw. Among them are: process, terminator, decision, data, document, display, manual loop, and many other specific symbols. The meaning for each symbol offered by ConceptDraw gives the presentation about their proposed use in professional Flowcharts for business and technical processes, software algorithms, well-developed structures of web sites, Workflow diagrams, Process flow diagram and correlation in developing on-line instructional projects or business process system. Use of ready flow chart symbols in diagrams is incredibly useful - you need simply drag desired from the libraries to your document and arrange them in required order. There are a few serious alternatives to Visio for Mac, one of them is ConceptDraw DIAGRAM. It is one of the main contender with the most similar features and capabilities.
How to Build a Flowchart

event-driven process chain diagram, EPC diagram, process chain flowchart Event-driven Process Chain Diagrams

event-driven process chain diagram, EPC diagram, process chain flowchart
Event-Driven Process Chain Diagrams solution extends ConceptDraw DIAGRAM functionality with event driven process chain templates, samples of EPC engineering and modeling the business processes, and a vector shape library for drawing the EPC diagrams and EPC flowcharts of any complexity. It is one of EPC IT solutions that assist the marketing experts, business specialists, engineers, educators and researchers in resources planning and improving the business processes using the EPC flowchart or EPC diagram. Use the EPC solutions tools to construct the chain of events and functions, to illustrate the structure of a business process control flow, to describe people and tasks for execution the business processes, to identify the inefficient businesses processes and measures required to make them efficient.

Basic Diagramming

Block diagrams are essentially a very simple format of diagrams. A variety of commonly used shapes and connecting lines, rules of construction and actions pertaining to them, make Block diagram a versatile and flexible tool for many forms of industry. Another advantage is the ease with which Block diagrams can be constructed, especially if you use professional diagramming software. ConceptDraw DIAGRAM software is an example of purpose built application designed with the form of process modeling in mind. It includes Block Diagrams solution from Diagrams area of ConceptDraw Solution Park for easy drawing professional-looking simple diagram - Block diagram, and a lot of other useful solutions for designing variety of other types of diagrams, schematics and flowcharts (Line graphs, Bar charts, Organizational charts, Histograms, Pie charts, Process flowcharts, Fault tree analysis diagrams, Scatter plots, Venn diagrams, Bubble diagrams, etc.). The RapidDraw functionality of ConceptDraw DIAGRAM lets create new objects and their connectors in just single-click.

Amazon Web Services Diagrams diagramming tool for architecture

Amazon Web Services (AWS) offers the reliable and relatively inexpensive cloud computing services. This is the main reason why many large companies prefer to use the Amazon Cloud to storage and operate the data. ConceptDraw DIAGRAM diagramming software enhanced with AWS Architecture Diagrams solution provides the powerful AWS diagramming tools to draw the Amazon architecture diagrams and Amazon Web Services planning diagrams, to develop the Architect infrastructure based on AWS in a few minutes. The AWS Architecture Diagrams solution offers variety of built-in samples and templates for several Amazon Web Services products and resources, a wide range of predesigned and recognizable vector graphic icons used for simple designing the Architecture diagrams. The diagrams created in ConceptDraw DIAGRAM are professional-looking, helpful when designing and implementing the AWS infrastructure based systems, useful to communicate design, deployment and topology, and apposite for using in presentations, whitepapers, datasheets, posters, and other technical materials you like.

Activity on Node Network Diagramming Tool

Activity on Node Network Diagramming Tool — Activity Network and Project Evaluation and Review Technique, or PERT, charts are a way of documenting and analyzing the tasks in a project. This sample shows the Activity on node network diagramming method. It was created in ConceptDraw DIAGRAM diagramming and vector drawing software using the Seven Management and Planning Tools solution from the Management area of ConceptDraw Solution Park.

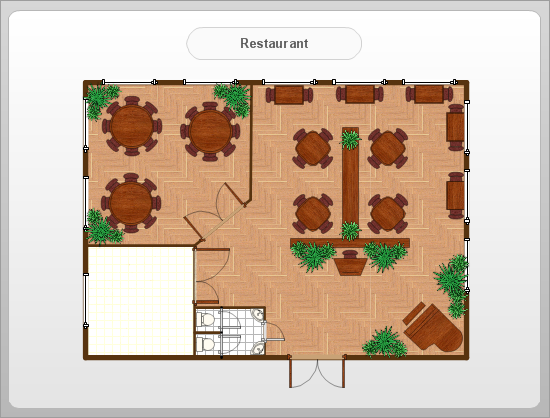
How To Create Restaurant Floor Plan in Minutes

Developing Floor Plans, Design Drawings, Plans of Furniture Placement for restaurants and cafes is one of the most responsible and important steps at their construction and designing. Selection of favorable design, the right style of furniture and decors largely determine the success and atmosphere of the institution. The restaurant floor planner ConceptDraw DIAGRAM is a perfect choice for architects and designers. Enhanced with Cafe and Restaurant Floor Plans solution it offers a lot of extensive vector symbol libraries and building plan elements for drawing Restaurant floor plans, Restaurant layouts, Restaurant furniture layouts, Cafe floor plans, Bar area floor plan, Fast food restaurant plan, etc. With ConceptDraw DIAGRAM you don't need to be an artist to create great-looking restaurant floor plan drawings in minutes, all needed drawing tools are delivered by Building Plans area solutions. Construct your own general plan of restaurant's premises, choose the furniture for your taste from the Cafe and Restaurant Floor Plans solution libraries and arrange it on the plan as you desire fast and easy. ConceptDraw DIAGRAM has many of the features found in Visio for Mac such as Drawing, Connection, Shape and Editing Tools.
What is ConceptDraw DIAGRAM