HelpDesk
How to Create a Sales Dashboard

 Sales Dashboard
Sales Dashboard solution extends ConceptDraw DIAGRAM software with templates, samples and library of vector stencils for drawing the visual dashboards of sale metrics and key performance indicators (KPI).
Sales Dashboard - insight about potential opportunities and key sales operations

Sales Dashboards for Your Company

Sales Dashboard
Sales Dashboard Solutions can help your sales team keep an eye on performance
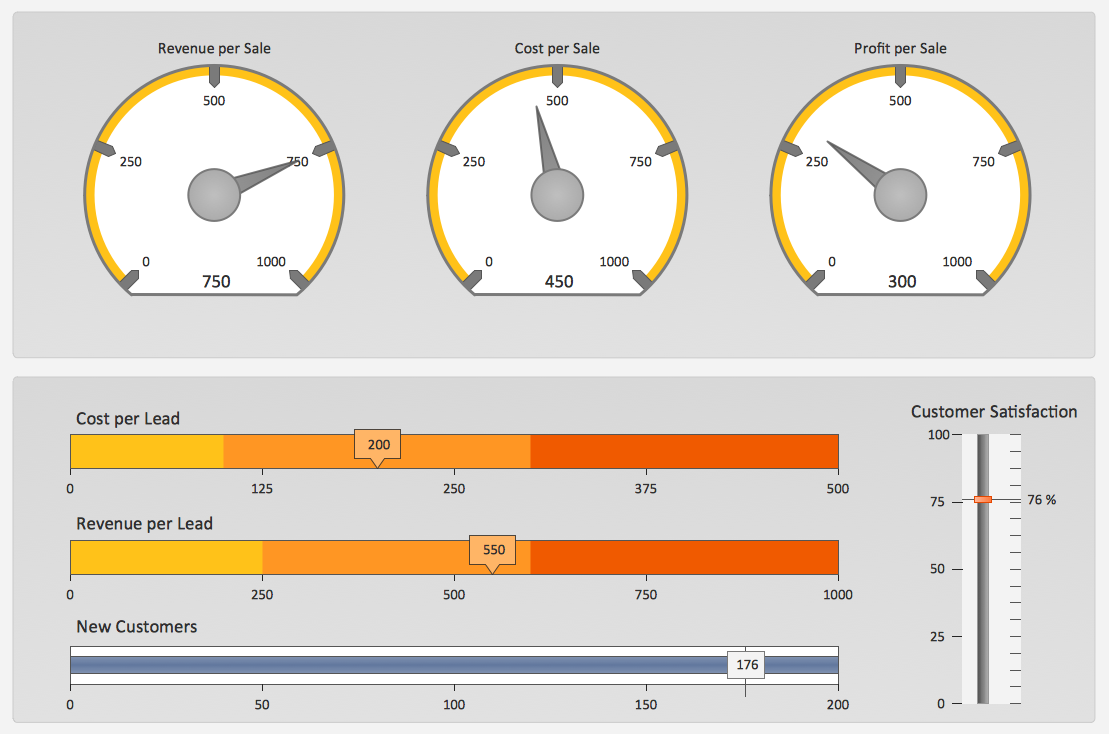
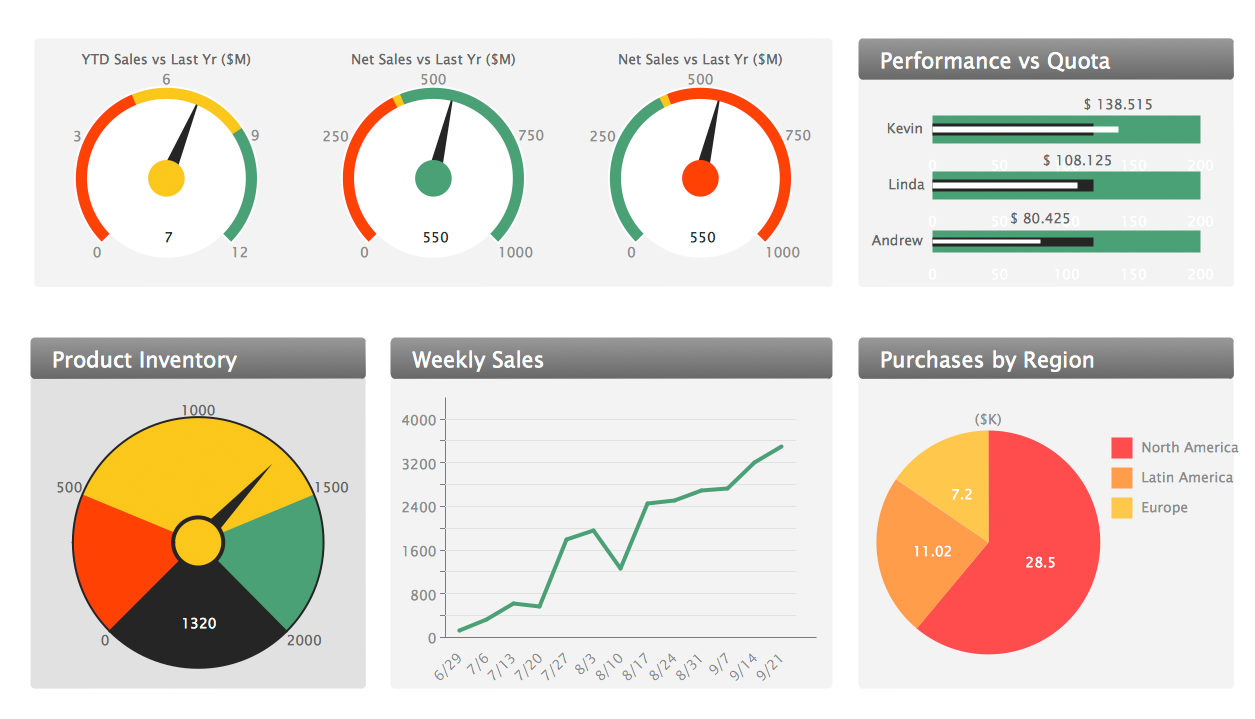
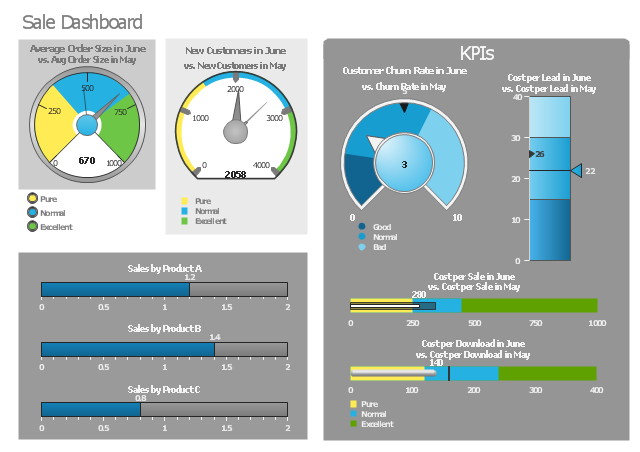
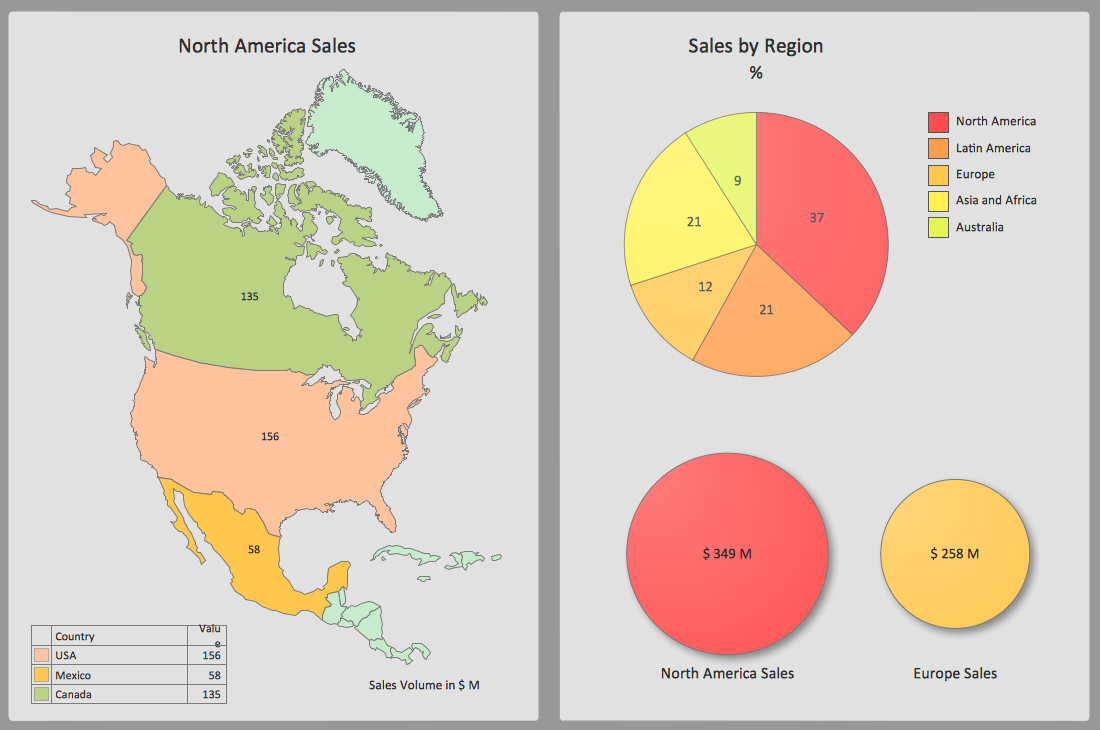
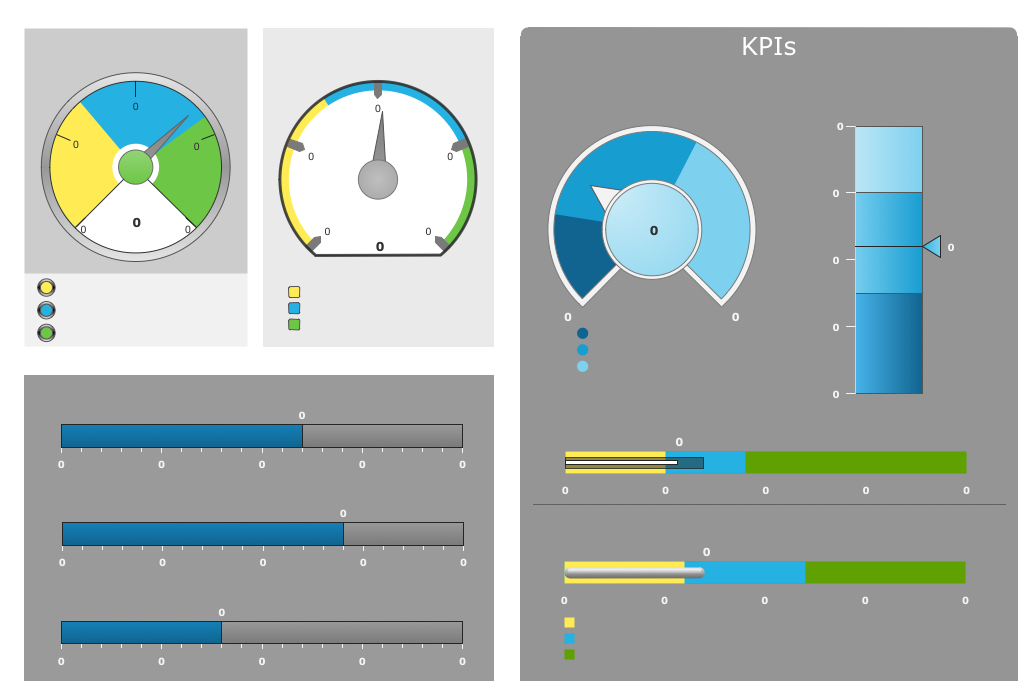
The example "Sale dashboard" displays the KPIs and sales effectiveness metrics visual indicators: speedometer gauge, dial, slider, level meter and bullet indicators.
"Sales intelligence (SI) refers to technologies, applications and practices for the collection, integration, analysis, and presentation of information to help salespeople keep up to date with clients, prospect data and drive business. In addition to providing metrics for win-loss and sales confidence, SI can present contextually relevant customer and product information. ...
Top performing companies have implemented sales intelligence programs to improve the quality and quantity of sales leads. SI contextualizes opportunities by providing relevant industry, corporate and personal information. Frequently SI's fact-based information is integrated or includes Customer Relationship Management (CRM).
Although some aspects of sales intelligence overlaps business intelligence (BI), SI is specifically designed for the use of salespeople and sales managers. Unlike customer relationship management (CRM) and traditional business intelligence (BI) applications, SI provides real-time analysis of current sales data and assists with suggesting and delivering actionable, relevant information." [Sales intelligence. Wikipedia]
The example "Sale dashboard" was created using the ConceptDraw PRO diagramming and vector drawing software extended with the Meter Dashboard solution from the area "What is a Dashboard" of ConceptDraw Solution Park.
Sales dashboard
Sales Dashboard Examples
Empower Your Sales Team With a Sales Dashboard
Visualize Sales Data Using Sample Data

- Sale dashboard
- KPI Dashboard | Performance Indicators | Sales Dashboard | Key ...
- Sales Dashboard | | | Dashboard Sales Profit
- Sales Dashboard | Meter Dashboard | PM Dashboards | Dashboard
- Sales Performance | Performance Indicators | Sales Dashboard ...
- Logistics Performance Dashboard - Template | Sales KPIs ...
- Sales Dashboard | ConceptDraw Dashboard for Facebook | How To ...
- Sales Dashboards for Your Company | A KPI Dashboard | The Facts ...
- Sales Dashboard | Value Stream Mapping | ATM UML Diagrams ...
- Fishbone Diagrams | Sales KPI Dashboards | Sales Flowcharts ...