Pie Chart Software
A pie chart is a circular diagram showing a set of data divided into proportional slices. There are several variations of this chart such as donut chart, exploded pie chart, multi-level pie charts. Although it is not very informative when a ring chart or circle chart has many sections, so choosing a low number of data points is quite important for a useful pie chart. ConceptDraw DIAGRAM software with Pie Charts solution helps to create pie and donut charts for effective displaying proportions in statistics, business and mass media for composition comparison, i.e. for visualization of part percentage inside one total.
 Sales Flowcharts
The Sales Flowcharts solution lets you create and display sales process maps, sales process workflows, sales steps, the sales process, and anything else involving sales process management.
Network Diagramming Software for Design. Cisco Network Diagrams
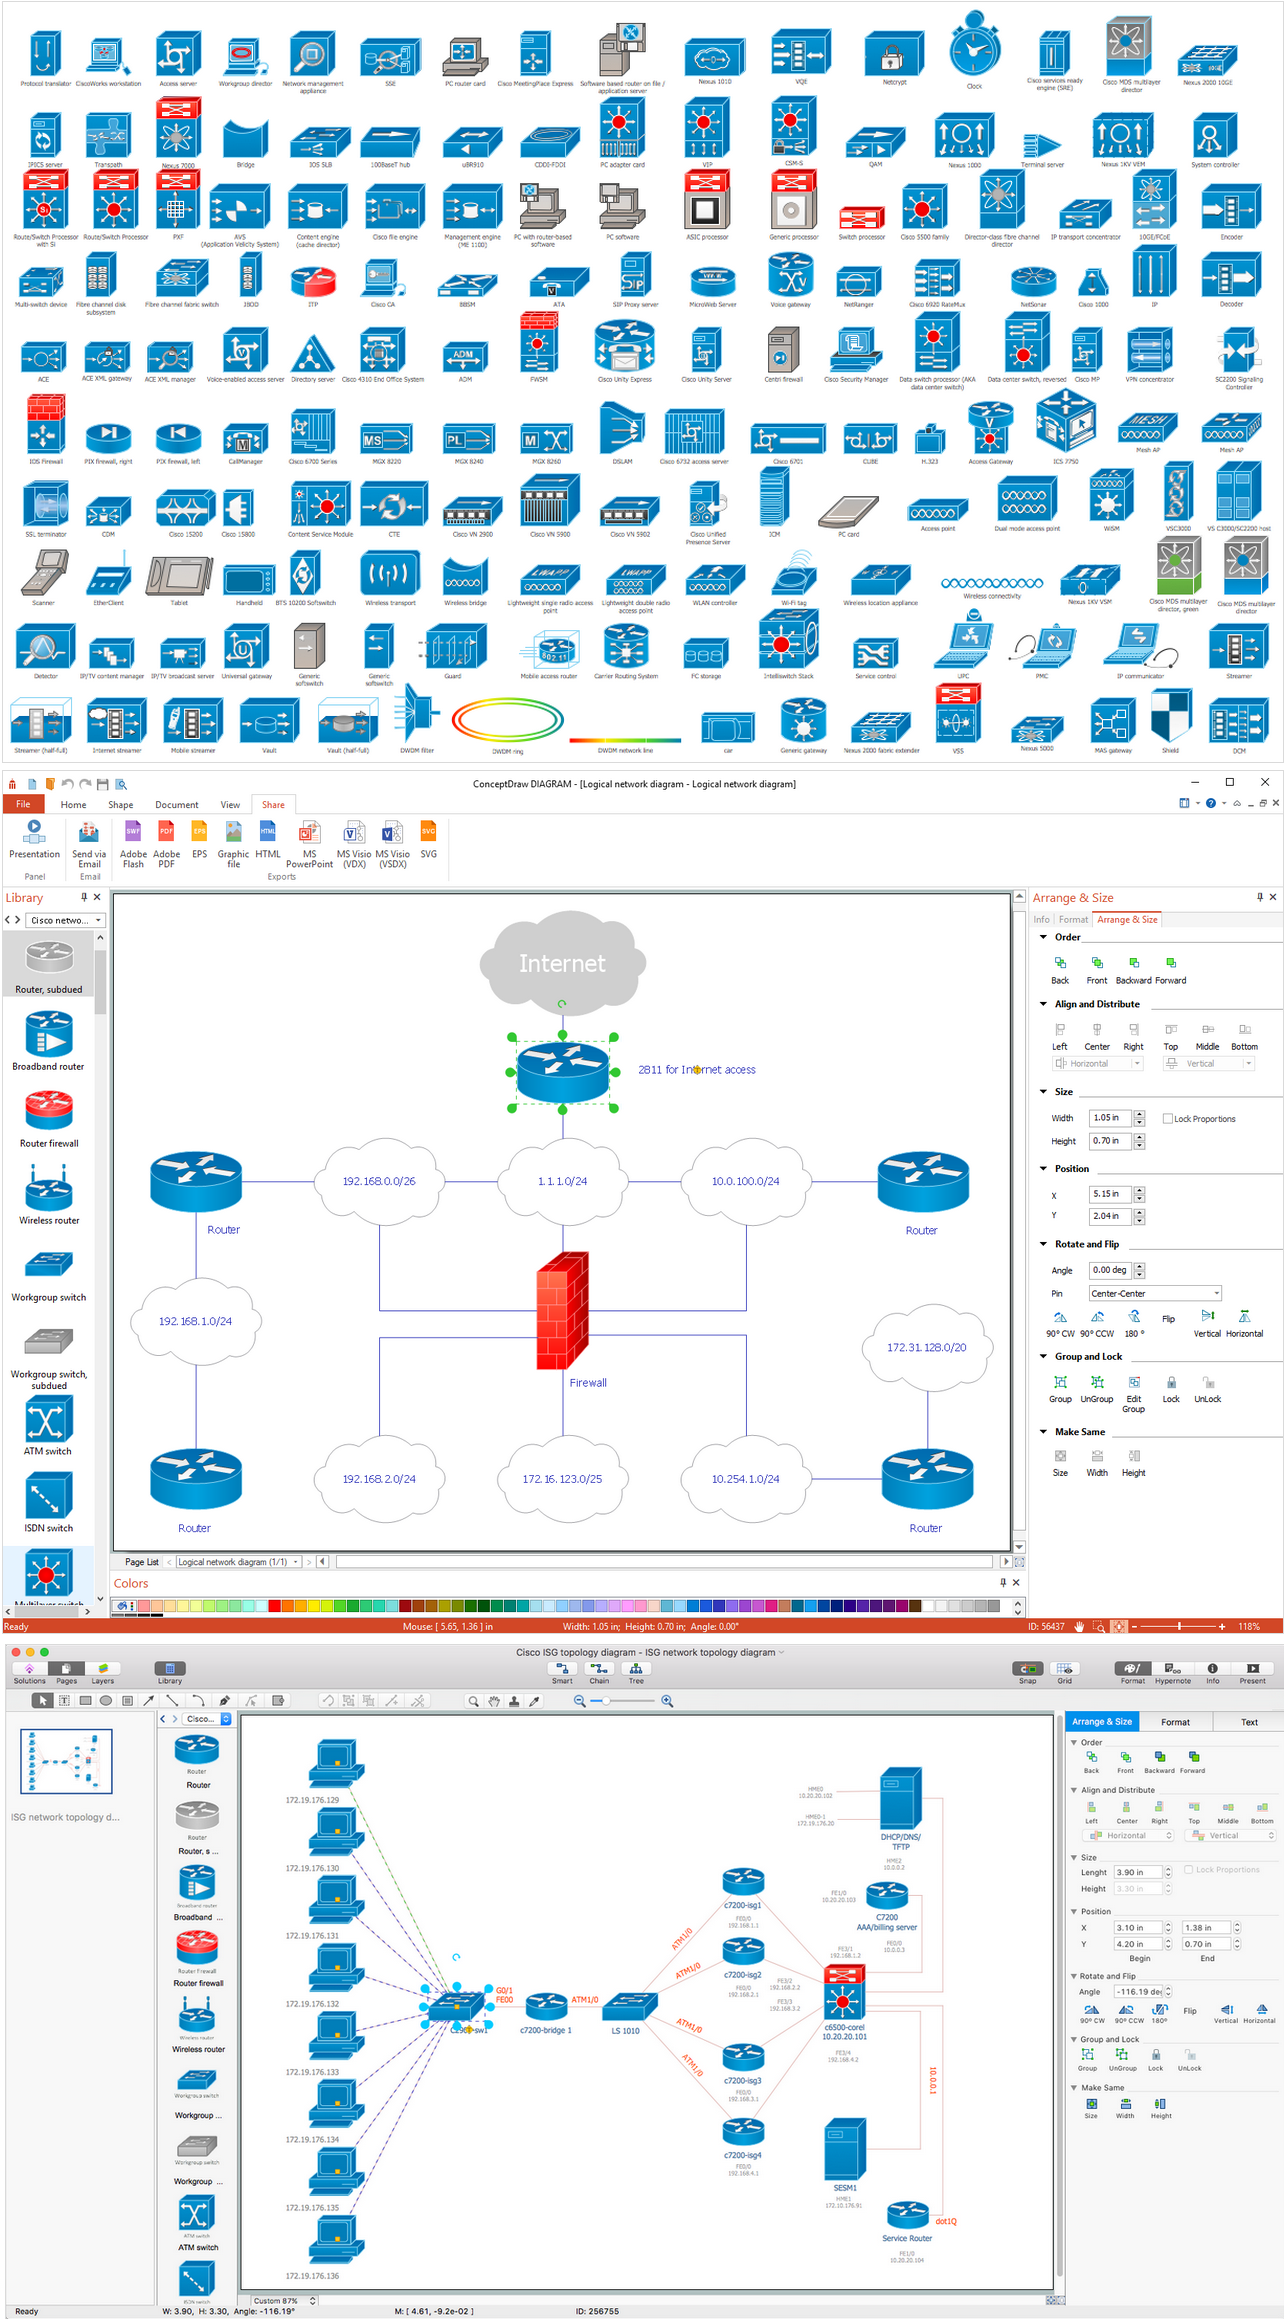
Cisco is a famous corporation that develops, manufactures and sells worldwide a networking equipment. Cisco Network Diagrams are intended to document the topology, to visualize Cisco networks, to illustrate the arrangement and connections of network equipment, using the own brand Cisco network symbols, generally accepted as standard. The Cisco icons depict specific Cisco network equipment and connections lines, the style of which specifies the type of physical connection. These diagrams are globally recognized, are often created and used by network and system administrators, network designers, and other numerous IT professionals and corporate IT departments. ConceptDraw DIAGRAM software provides the set of powerful network diagrams software tools included to the Cisco Network Diagrams solution from Computer and Networks area of ConceptDraw Solution Park. This solution offers 15 libraries with 508 cisco vector elements that are ideal for professional and easy design Cisco Network Diagrams of any configuration, complexity and detailing.
 Marketing Diagrams
Marketing Diagrams solution extends ConceptDraw DIAGRAM diagramming software with abundance of samples, templates and vector design elements intended for easy graphical visualization and drawing different types of Marketing diagrams and graphs, including Branding Strategies Diagram, Five Forces Model Diagram, Decision Tree Diagram, Puzzle Diagram, Step Diagram, Process Chart, Strategy Map, Funnel Diagram, Value Chain Diagram, Ladder of Customer Loyalty Diagram, Leaky Bucket Diagram, Promotional Mix Diagram, Service-Goods Continuum Diagram, Six Markets Model Diagram, Sources of Customer Satisfaction Diagram, etc. Analyze effectively the marketing activity of your company and apply the optimal marketing methods with ConceptDraw DIAGRAM software.
Software and Database Design with ConceptDraw DIAGRAM
Unified Modeling Language (abbr. UML) is a modeling language used by software developers and software engineers for developing diagrams, expressive modeling, visualization, construction, specification, and documentation an information about software-intensive systems. There are used many types of UML diagrams, joined in main groups, each of them has its own functional abilities and applications: Behaviour diagrams illustrate the functionality of software systems, Structuring diagrams depict a structure of objects at the systems, Interaction diagrams show the flow of control and data among the things in a modeling system. UML has a lot of practical applications in varied areas, among them software development, hardware design, banking and financial services, telecommunication, science, research, enterprise information system, distributed Web-based services, user interfaces for web applications, medical electronics, patient healthcare systems, etc. ConceptDraw DIAGRAM extended with Rapid UML solution is a perfect tool for UML diagramming.Venn Diagram Examples for Problem Solving. Environmental Social Science. Human Sustainability Confluence
The Venn diagram example below shows sustainable development at the confluence of three constituent parts. Create your Venn diagrams for problem solving in environmental social science using the ConceptDraw DIAGRAM diagramming and vector drawing software extended with the Venn Diagrams solution from the area "Diagrams" of ConceptDraw Solution Park.- ConceptDraw PROJECT Project Management Software Tool | How ...
- Cisco Network Diagram Software
- Pyramid Diagram | Project Timeline | Project — Assigning ...
- A KPI Dashboard Provides the Answers Your Sales Team | KPI ...
- What is Gantt Chart (historical reference) | PM Teams | PM Personal ...
- Project management - Design Elements | Management - Design ...
- How To Use Collaboration Tool in Project Management | How To ...
- http://www.conceptdraw.com/examples/uuo-element daily 0.56 http ...
- Quality Project Management with Mind Maps | PM Easy | One ...
- Cisco Routers. Cisco icons, shapes, stencils and symbols | Cisco ...
- Quality Project Management with Mind Maps | Concept Maps | Mind ...
- Project —Task Trees and Dependencies | Software Work Flow ...
- PM Presentations | Process Flowchart | Plant Layout Plans | Project ...
- Mathematics Symbols | Mathematics | Value Stream Mapping | Math ...
- Quality Project Management with Mind Maps | One formula of ...
- SWOT Analysis | SWOT and TOWS Matrix Diagrams | How to Make ...
- Service-goods continuum diagram | Pyramid Diagram | Marketing ...
- Basic Flowchart Symbols and Meaning | Computer and Internet use ...
- Sales Process Map | Sales Process Flowcharts | Sales Process ...
- Food infogram - Reducing sodium | Banquet Hall Plan Software ...


