This site uses cookies. By continuing to browse the ConceptDraw site you are agreeing to our Use of Site Cookies.

Interior Design. Office Layout Plan Design Element

While developing an office layout, it is important to choose a right office space. One should take into account that some layouts are suitable for frequent communication among employees and are inappropriate for a high level of concentration, and vice versa, private offices are not convenient for frequent communication.
ConceptDraw Building Drawing Tools - draw simple office layout plans easily with Office Layout Plan Design Element. Use it to draw office interior design floor plans, office furniture and equipment layouts, and blueprints for facilities management, move management, office supply inventories, assets inventories, office space planning.
How to Draw a Floor Plan
HelpDesk

How to Create a Bar Chart

Bar charts (bar graphs) are diagrams displaying data as horizontal or vertical bars of certain heights. Bar charts are widely used to show and compare the values of the same parameters for different data groups.
The bar graph can be vertical or horizontal. This depends on the number of categories. There are many methods in which bar graph can be built and this makes it a very often used chart type. Usually, a bar chart is created so that the bars are placed vertically. Such an arrangement means that the bar's height value is proportional to the category value. Nevertheless, a bar chart can be also drawn horizontally. This means that the longer the bar, the bigger the category. Thus, a bar chart is a good way to present the relative values of different measured items. The ConceptDraw Bar Graphs solution allows you to draw a bar chart quickly using a vector library, containing the set of various bar charts objects.
HelpDesk

How to Draw a Histogram

Histogram is a diagram used to visualize data through bars of variable heights. Making histogram can be helpful if you need to show data covering various periods (hours, days, weeks, etc). When the vertical column of the histogram refer to frequency it shows how many times any event happens. It is a Frequency histogram. A bar chart diagram is similar to a histogram, but in contrast to a bar chart a histogram represents the number how many times there have been certain data values. You can use a histogram to depict continual data flow such as temperature, time, etc. You can effortlessly draw histograms using the Histograms solution for CnceptDraw DIAGRAM. Making a histogram can by very useful to represent various statistical data.
HelpDesk

How to Develop a Business Process Model

An overview of any business process includes the description of the steps needed to implement any business task. The best approach to business process designing and analyzing is to depict visually the steps of the business process in the form of the business process diagram. Designing a Business Process diagram includes many different and specific elements that can be managed using ConceptDraw DIAGRAM. The ability to create Business Process diagrams according to the BPMN 2.0 is provided by the Business Process Model and Notation solution.
HelpDesk

How to Connect a Live Object to a Text Data Source

You can easily create a visual dashboard using charts and graphics indicators from Live Objects libraries. Here is an instruction on how to connect a ConceptDraw live object with data source files in TXT format to visualize the actual values of your performance metrics.
HelpDesk

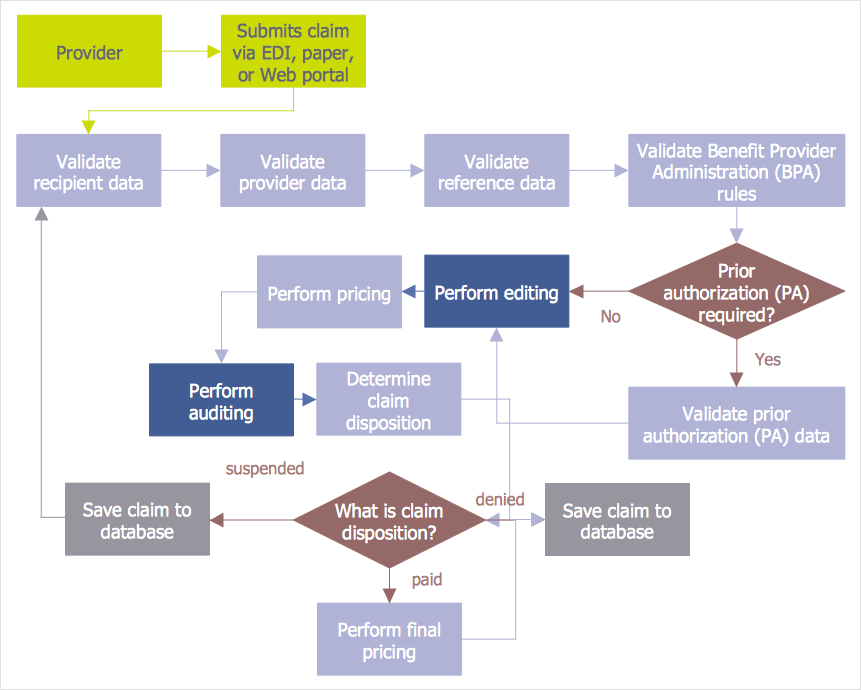
How to Create an Audit Flowchart

Audit flowcharts are often used in auditors activity. This is the most effective way of preparation and documentation of the audit process. Financial audit process has a clear structure, and therefore audit flowchart is often used to denote an audit process. This is the most effective way of preparation and documentation of the audit process. Flowcharts are often used in auditors activity. A flowchart may be created at any stage of an audit process as an aid in the determination and evaluation of a client's accounting system. ConceptDraw DIAGRAM allows you to create professional accounting flowchart quickly using the professional Audit Flowcharts solution.
HelpDesk

How to Draw an Electrical Scheme Using Electrical Engineering Solution

The circuit diagram shows the scheme of a location of components and connections of the electrical circuit using a set of standard symbols. It can be used for graphical documentation of electrical circuit components. There are many different electric circuit symbols that can be used in a circuit diagram. Knowing how to read circuit diagrams is a useful skill not only for professionals but for any person who can start creating his own small home electronic projects. The ability to visualize industrial systems in electronics, electrical, chemical, process, and mechanical engineering is delivered by the ConceptDraw Electrical Engineering solution.
HelpDesk

How to Create a Picture Graph

Picture Graphs are used commonly to represent non-complex data to a large audience. A Picture Graph is a simple kind of marketing diagram used to show the relationship among various quantities. It includes pictures or symbols to represent information visually. There are many cases when you have just some numbers to show and compare. This is not a reason to not use visual tools. You can produce a simple picture graph using memorable symbols to get the best visual presentation. Using specific symbols instead of regular colored bars makes picture graphs a much more descriptive tool. You can use tools from an existing library or find appropriate clipart in ConceptDraw’s collection. ConceptDraw DIAGRAM allows you to draw a simple and easy to understand Picture Charts using the special library.
HelpDesk

How to Add conceptdraw.com Domain to Custom Safe Senders List

Instruction on how to add the csodessa to your safe senders' list in order to help ensure that you receive the CS Odessa email that confirms your successful registration.
HelpDesk

How to Create an IDEF0 Diagram for an Application Development

IDEF0 methods are intended to model the functions of a process, creating a graphical model that displays: what controls the function, who makes it, what resources are used and how they are connected with other functions. The IDEF0 tool is used to model the decisions, actions, and activities of a software system during the development process. IDEF0 diagram graphically depicts a model of a desired version of the application. ConceptDraw DIAGRAM allows you to create and communicate the IDEF0 diagrams of any complexity.
HelpDesk

How to Create an Electrical Diagram

There are many different electric circuit symbols that can be used in a circuit diagram. Knowing how to read circuit diagrams is a useful skill not only for professionals but for any person who can start creating his own small home electronic projects. The circuit diagram shows the scheme of a location of components and connections of the electrical circuit using a set of standard symbols. It can be used for graphical documentation of electrical circuit components.
The ability to create electrical diagrams and schematic using ConceptDraw DIAGRAM is delivered by the Electrical Engineering solution. The solution supplied with samples, templates, and libraries of design elements for drawing electrical schematics, digital and analog logic, circuit and wiring schematics and diagrams, power systems diagrams, maintenance and repair diagrams for electronics and electrical engineering.
HelpDesk

How to Draw a Pie Chart

A pie chart represents data, in a clear and easy to read around (pie) form. A circular pie chart is divided into sections (slice). Each "slice" depicts the It reflects the proportion of each component in the whole "pie". This type of chart is most often used for the visualization of statistical data. That is why pie charts are widely used in marketing. As the pie charts show proportional parts of a whole, they are good for various visual comparisons. For example, it is difficult to imagine a more intuitive way to show segmentation and market share. ConceptDraw DIAGRAM allows you to draw a simple and clear Pie Chart using the Pie Charts solution.
HelpDesk

How to Draw a Circular Arrows Diagram

The cyclic recurrence is a fundamental property of multiple systems. The cycle is a process which consists of elements (phases, stages, stages) following each other. Many processes in astronomy, biology, chemistry, physics, mathematics, etc. have a cycle properties. It is also widely used in information technologies and marketing analysis. Graphical representation of cyclic processes can have many forms. It can be a circle, parabola, hyperbola, ellipse, and others. A Circular Arrows Diagram is used as one of the statistical charts in the business, mass media and marketing. ConceptDraw DIAGRAM provides tools for making easy drawing Circular Arrows Diagrams.
HelpDesk

How to Draw a Fishbone Diagram

Fishbone (Ishikawa) Diagram is often used in business to determine the cause of some problem. A Fishbone diagram is also called a cause-and-effect diagram. The main goal of the Fishbone diagram is to illustrate in a graphical way the relationship between a given outcome and all the factors that influence this outcome. The complete diagram resembles a fish skeleton as its name implies. Cause and Effect analysis is used in management to identify the possible causes of a problem in order to eliminate them. The ability to create a Fishbone Diagram is supported by the Fishbone Diagram solution.
HelpDesk

How to Design an Interface Mockup for iPhone Application

The Apple iPhone user interface has become something of a standard for smartphones, and mobile devices in general. A well-designed user interface (UI) is very important for user-friendly navigation and the best correlation with operating system logic. Development of successful iPhone App UI requires a planning and prototyping stage. An iPhone UI diagram can be employed to give a general view of the device's screen, upon which elements can be placed and re-arranged as necessary. Using ConceptDraw DIAGRAM you can mock-up an iPhone UI system so that you can figure out how best to represent user interface (UI) elements for the development of a new iPhone App.
HelpDesk

How to Draw a Line Chart Quickly

A common line chart is a graphical representation of the functional relationship between two series of data. A line chart that is created by connecting a series of data points together with a straight line is the most basic type of a line chart. A line chart can be used for depicting data that changes continuously over time. It is extensively utilized in statistics, marketing, and financial business. ConceptDraw Basic Line Graph solution provides the possibility to make 2D line charts quickly and effortlessly.
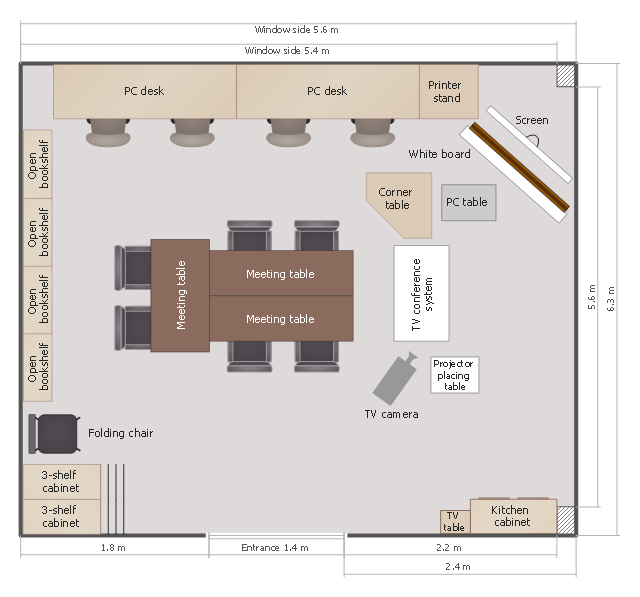
This classroom floor plan sample shows the furniture and equipment layout.
It was created on the base of the drawing from the website of Okinawa Prefectural College of Nursing, Graduate School. [okinawa-nurs.ac.jp/ gp/ english/ 04miyako/ 04miyako-2.html]
The interior design example "Classroom floor plan" was created using the ConceptDraw PRO diagramming and vector drawing software extended with the School and Training Plans solution from the Building Plans area of ConceptDraw Solution Park.
Floor plan
Floor plan, teacher's desk, desk, screen, room, rolling chair, rectangular table, table, rectangular column, column, folding chair, door, corner table, table, chalkboard, chair with arms, camera, cabinet, drawer, bookcase, base cabinet, base,