HelpDesk
How to Add a Block Diagram to a PowerPoint Presentation Using ConceptDraw PRO
A block diagram is a useful tool both in designing new processes, and in improving existing. A block diagram is a type of chart, which is often used in presentations, because of its universality - the graphic blocks can be applied to many processes.The PowerPoint presentation of major process steps and key process participants can be very informative and helpful. Using ConceptDraw PRO, you can easily convert a block diagram to MS PowerPoint presentation.
 Total Quality Management TQM Diagrams
Total Quality Management Diagrams solution extends ConceptDraw PRO software with samples, templates and vector stencils library for drawing the TQM flowcharts.
 Event-driven Process Chain Diagrams
Event-driven Process Chain (EPC) Diagram is a type of flowchart widely used for modeling in business engineering and reengineering, business process improvement, and analysis. EPC method was developed within the Architecture of Integrated Information Systems (ARIS) framework.
HelpDesk
How to Create a Network Security Diagram Using ConceptDraw PRO
Network security requires constant work and attention to details. Each user, whether an individual or organization, owns an information, considered to be valuable. The enforcement of network security, whether it be a local network security, or wireless network security is core for creating the secure environment of the daily working processes. Network security is accomplished through hardware and software. Network security system must be sophisticated and modern inside, but simple and understandable for the user. The visual scheme of security system can be presented in the form of a Network Security diagram. ConceptDraw PRO provides the toolkit for network security system visualization with its Network Security Diagram solution.HelpDesk
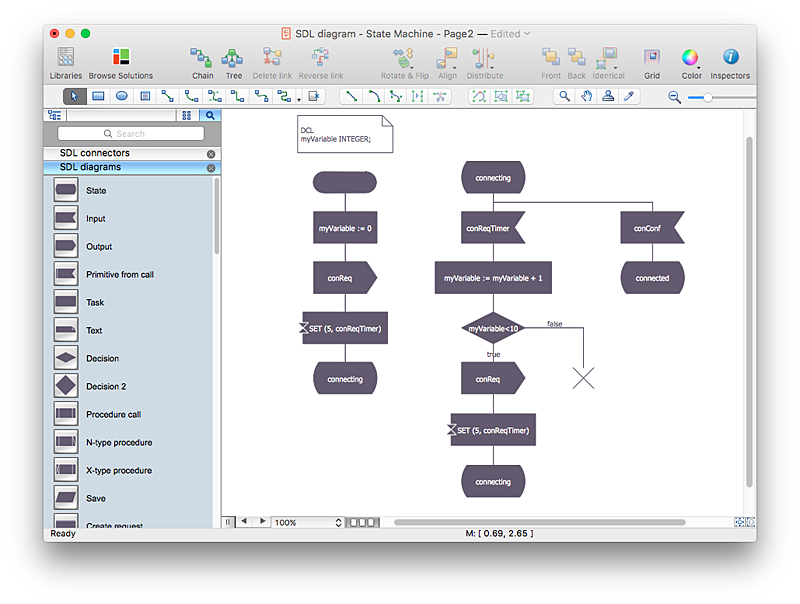
How to Create a SDL Diagram Using ConceptDraw PRO
Specification and Description Language (SDL) is intended to describe systems that switched state often and rapidly. An SDL diagram is a view of system, that can depict a single process, or complex relationships between a number of elements. The SDL diagram supports a nested hierarchy. A system is devided into blocks, each of them can be describes as a process, until finally one can see the initial procedures that make up each process. The advantage of this method is that a system can be viewed in manageable part thatcan be followed separately. ConceptDraw Specification and Description Language solution contains the library, with a SDL notation in a vector stencil graphics. The SDL solution also provides a set of samples, to show the level of hierarchical detail that is possible.
 Food Court
Use the Food Court solution to create food art. Pictures of food can be designed using libraries of food images, fruit art and pictures of vegetables.
 Cross-Functional Flowcharts
Cross-functional flowcharts are powerful and useful tool for visualizing and analyzing complex business processes which requires involvement of multiple people, teams or even departments. They let clearly represent a sequence of the process steps, the order of operations, relationships between processes and responsible functional units (such as departments or positions).
- On Page Connector
- Fishbone diagram - HAN project | Flowchart Components | Contoh ...
- Basic Flowchart Symbols and Meaning | Flowchart | Contoh ...
- How To use House Electrical Plan Software | Audio and Video ...
- Contoh Flowchart | TQM diagrams - Vector stencils library | Flow ...
- Process Flow app for macOS | Creating a Simple Flowchart ...
- Accounting Flowchart: Purchasing, Receiving, Payable and ...
- Process Flowchart | Contoh Flowchart | SDL Flowchart Symbols ...
- Flowchart Examples and Templates | Diagram Flow Chart | Creating ...
- Flowchart For Login Page
- Accounting Flowchart Symbols | Process Flowchart | Basic Flowchart ...
- Process Flowchart | Accounting Flowchart Symbols | Account ...
- Contoh Flowchart | Cross-Functional Flowcharts | Basic Flowchart ...
- Flowchart | Example Process Flow | Basic Flowchart Symbols and ...
- Diagramming Software for UML Composite Structure Diagrams ...
- Double-headed Cross Functional Flowchart | What is a Cross ...
- Basic Flowchart Symbols and Meaning | Flowchart | Process ...
- Contoh Flowchart | Business diagrams & Org Charts with ...
- Basic Flowchart Symbols and Meaning | Website launch - Flowchart ...


