 Computer Network Diagrams
Computer Network Diagrams solution extends ConceptDraw PRO software with samples, templates and libraries of vector stencils for drawing the computer network topology diagrams.
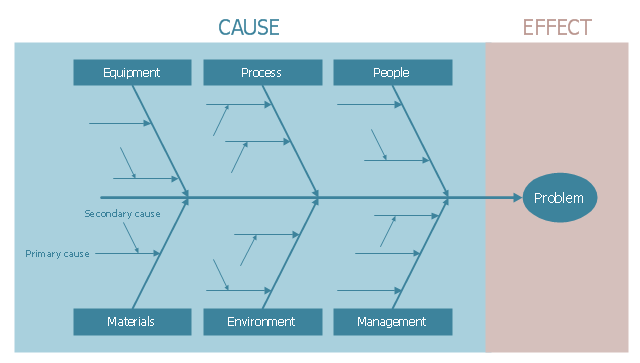
This cause-and-effect diagram example was redesigned from the Wikimedia Commons file: Ishikawa Fishbone Diagram.svg. [commons.wikimedia.org/ wiki/ File:Ishikawa_ Fishbone_ Diagram.svg]
"Ishikawa diagrams (also called fishbone diagrams, herringbone diagrams, cause-and-effect diagrams, or Fishikawa) are causal diagrams created by Kaoru Ishikawa (1968) that show the causes of a specific event. Common uses of the Ishikawa diagram are product design and quality defect prevention to identify potential factors causing an overall effect. Each cause or reason for imperfection is a source of variation. Causes are usually grouped into major categories to identify these sources of variation. The categories typically include
- People: Anyone involved with the process
- Methods: How the process is performed and the specific requirements for doing it, such as policies, procedures, rules, regulations and laws
- Machines: Any equipment, computers, tools, etc. required to accomplish the job
- Materials: Raw materials, parts, pens, paper, etc. used to produce the final product
- Measurements: Data generated from the process that are used to evaluate its quality
- Environment: The conditions, such as location, time, temperature, and culture in which the process operates" [Ishikawa diagram. Wikipedia]
The example "Ishikawa fishbone diagram" was created using the ConceptDraw PRO software extended with the Seven Basic Tools of Quality solution from the Quality area of ConceptDraw Solution Park.
Cause-and-effect diagram example
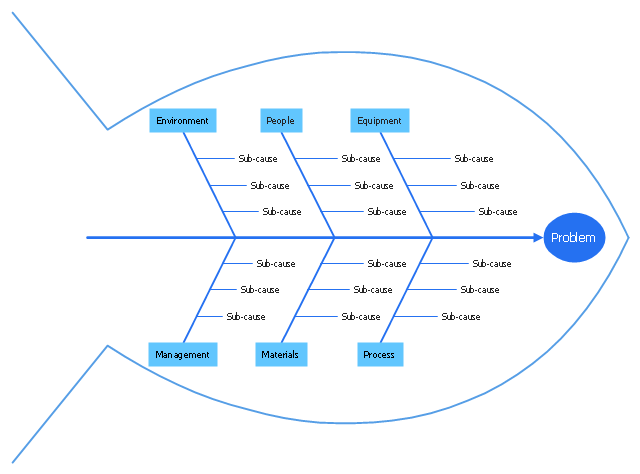
"Common uses of the Ishikawa diagram are product design and quality defect prevention, to identify potential factors causing an overall effect. Each cause or reason for imperfection is a source of variation. Causes are usually grouped into major categories to identify these sources of variation. The categories typically include:
(1) People: Anyone involved with the process;
(2) Methods: How the process is performed and the specific requirements for doing it, such as policies, procedures, rules, regulations and laws;
(3) Machines: Any equipment, computers, tools, etc. required to accomplish the job;
(4) Materials: Raw materials, parts, pens, paper, etc. used to produce the final product;
(5) Measurements: Data generated from the process that are used to evaluate its quality;
(6) Environment: The conditions, such as location, time, temperature, and culture in which the process operates. ...
Ishikawa diagrams were popularized by Kaoru Ishikawa in the 1960s, who pioneered quality management processes in the Kawasaki shipyards, and in the process became one of the founding fathers of modern management.
The basic concept was first used in the 1920s, and is considered one of the seven basic tools of quality control." [Ishikawa diagram. Wikipedia]
This quality Ishikawa diagram (cause and effect diagram) template is included in the Fishbone Diagram solution from the Management area of ConceptDraw Solution Park.
Quality fishbone diagram
Venn Diagram Examples for Problem Solving. Environmental Social Science. Human Sustainability Confluence

Create your Venn diagrams for problem solving in environmental social science using the ConceptDraw PRO diagramming and vector drawing software extended with the Venn Diagrams solution from the area "What is a Diagram" of ConceptDraw Solution Park.
 Workflow Diagrams
Workflow Diagrams solution extends ConceptDraw PRO software with samples, templates and vector stencils library for drawing the work process flowcharts.
 Mechanical Engineering
This solution extends ConceptDraw PRO v.9 mechanical drawing software (or later) with samples of mechanical drawing symbols, templates and libraries of design elements, for help when drafting mechanical engineering drawings, or parts, assembly, pneumatic,
 Entity-Relationship Diagram (ERD)
Entity-Relationship Diagram (ERD) solution extends ConceptDraw PRO software with templates, samples and libraries of vector stencils from drawing the ER-diagrams by Chen's and crow’s foot notations.
HelpDesk
How to Draw a Pyramid Diagram in ConceptDraw PRO

 Block Diagrams
Block diagrams solution extends ConceptDraw PRO software with templates, samples and libraries of vector stencils for drawing the block diagrams.
 Language Learning
Language Learning solution extends ConceptDraw PRO software with templates, samples and library of vector stencils for drawing the sentence diagrams.
- Computer and Networks Area | ConceptDraw PRO Network ...
- Fishbone Diagram | Network Diagram Software LAN Network ...
- Fishbone Diagram | ConceptDraw PRO Network Diagram Tool ...
- ConceptDraw Solution Park | ConceptDraw Solution Park | Fishbone ...
- Entity Relationship Diagram Examples | Local area network (LAN ...
- Using Fishbone Diagrams for Problem Solving | Cause and Effect ...
- ConceptDraw PRO Network Diagram Tool | Wireless Networks ...
- Computer and Networks Area | Computer Network Diagrams ...
- ConceptDraw PRO Network Diagram Tool | Computer and Networks ...
- Process Flowchart | How to Draw a Computer Network Diagrams ...
- Fishbone diagram - Causes of low-quality output | Design elements ...
- Telecommunication Network Diagrams | Computer Network ...
- How to Draw a Computer Network Diagrams | Process Flowchart ...
- Mechanical Engineering | Venn Diagrams | How to Create a ...
- AWS Architecture Diagrams | Fishbone Diagram | AWS Simple Icons ...
- ConceptDraw PRO Network Diagram Tool | Network Topologies ...
- Computer and Networks Area | Entity-Relationship Diagram (ERD ...
- Cause and Effect Analysis ( Fishbone Diagrams ) | Fishbone diagram ...
- Business Productivity Diagramming | Fishbone diagram - Inability to ...
- Enterprise Architecture Diagrams | Computer and Networks Area ...