HelpDesk
How To Convert a Block Diagram to Adobe PDF Using ConceptDraw PRO

HelpDesk
How To Convert a Concept Map to Adobe PDF Using ConceptDraw PRO

HelpDesk
How to Make Network Diagram

 Concept Maps
The technique of concept mapping was developed as a constructive way of representing knowledge in science and increasing the meaningfulness of learning. Now, the creation of a concept map is extremely helpful when used in education as learning and teaching techniques that assist memorization. Concept maps are also used for idea generation in brainstorming sessions, and for detailing the structure of complex ideas.
 Business Process Diagrams
Business Process Diagrams solution extends the ConceptDraw PRO BPM software with RapidDraw interface, templates, samples and numerous libraries based on the BPMN 1.2 and BPMN 2.0 standards, which give you the possibility to visualize equally easy simple and complex processes, to design business models, to quickly develop and document in details any business processes on the stages of project’s planning and implementation.
HelpDesk
How to Create an IDEF0 Diagram for an Application Development

HelpDesk
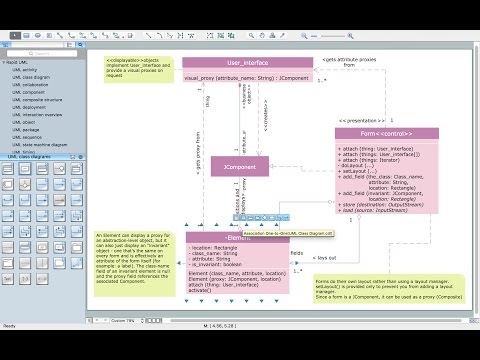
How to Create a UML Diagram Using ConceptDraw PRO

 AWS Architecture Diagrams
The flexible AWS cloud solutions will help you to create reliable applications with a high level of scaling in the AWS cloud, to run your applications and accelerate their work on the level of security. Besides AWS resources are available worldwide and yo
 Circular Arrows Diagrams
Circular Arrows Diagrams solution extends ConceptDraw PRO v10 with extensive drawing tools, predesigned samples, Circular flow diagram template for quick start, and a library of ready circular arrow vector stencils for drawing Circular Arrow Diagrams, Segmented Cycle Diagrams, and Circular Flow Diagrams. The elements in this solution help managers, analysts, business advisers, marketing experts, scientists, lecturers, and other knowledge workers in their daily work.
 Fishbone Diagram
Fishbone Diagrams solution extends ConceptDraw PRO software with templates, samples and library of vector stencils for drawing the Ishikawa diagrams for cause and effect analysis.
 Venn Diagrams
Venn Diagrams are actively used to illustrate simple set relationships in set theory and probability theory, logic and statistics, mathematics and computer science, linguistics, sociology, and marketing. Venn Diagrams are also often used to visually summarize the status and future viability of a project.
 Target and Circular Diagrams
This solution extends ConceptDraw PRO software with samples, templates and library of design elements for drawing the Target and Circular Diagrams.
- Pdf For How To Draw Component Diagram
- Software Component Diagram Pdf
- ConceptDraw PRO Network Diagram Tool | Server Rack Parts Pdf
- Network diagrams with ConceptDraw PRO | Computer and Networks
- Network Diagram Examples
- About UML | UML Diagram | UML state machine diagram - State ...
- How To use Switches in Network Diagram | Communication network ...
- UML Component Diagram Example - Online Shopping | State ...
- How To Convert a Block Diagram to Adobe PDF Using ...
- State Diagram Example - Online Store | UML Component Diagram ...
- How To Convert a Computer Network Diagram to Adobe PDF Using ...
- Cisco Network Templates | Draw Network Diagram based on ...
- ConceptDraw PRO Network Diagram Tool | Network Security ...
- Diagram of a Basic Computer Network. Computer Network Diagram ...
- Wiring Diagrams with ConceptDraw PRO | Basic Network Diagram ...
- Exporting Circle Diagram
- Entity Relationship Diagram Symbols and Meaning ERD Symbols ...
- Component Diagram Example Ppt
- Bus network topology diagram | Network Diagram Examples ...
- ConceptDraw PRO Network Diagram Tool | Computer and Networks ...