Model Based Systems Engineering

UML Deployment Diagram Example - ATM System UML diagrams

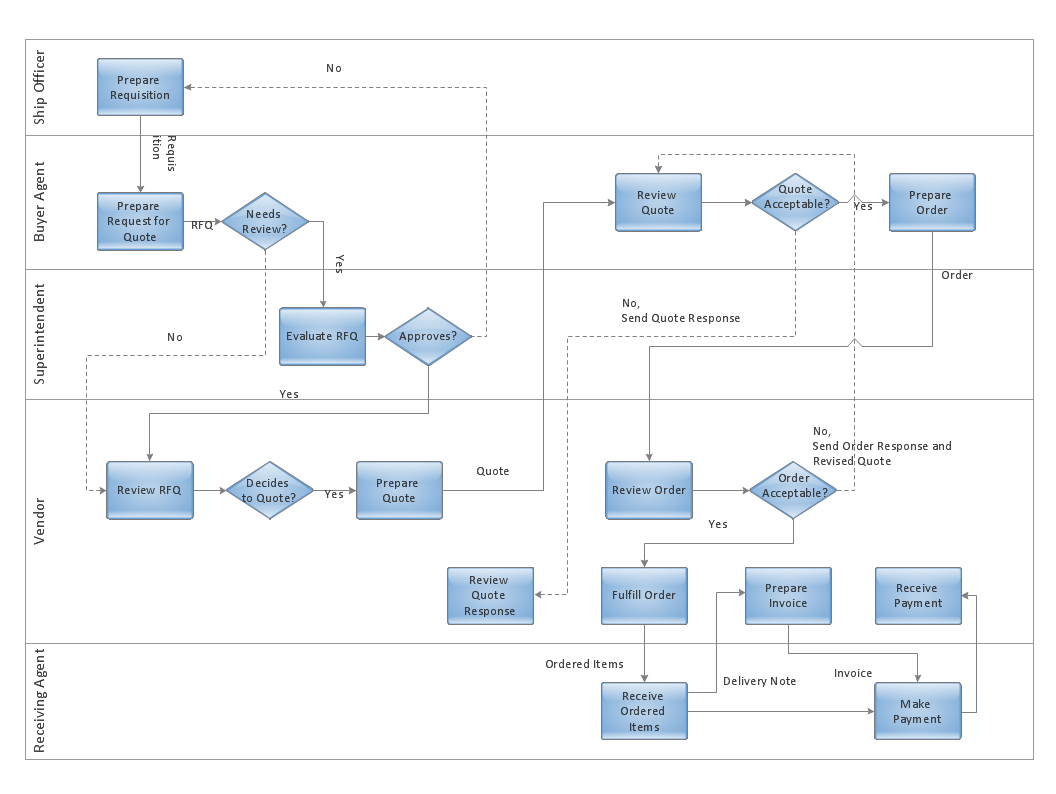
Cross-Functional Flowcharts in ConceptDraw
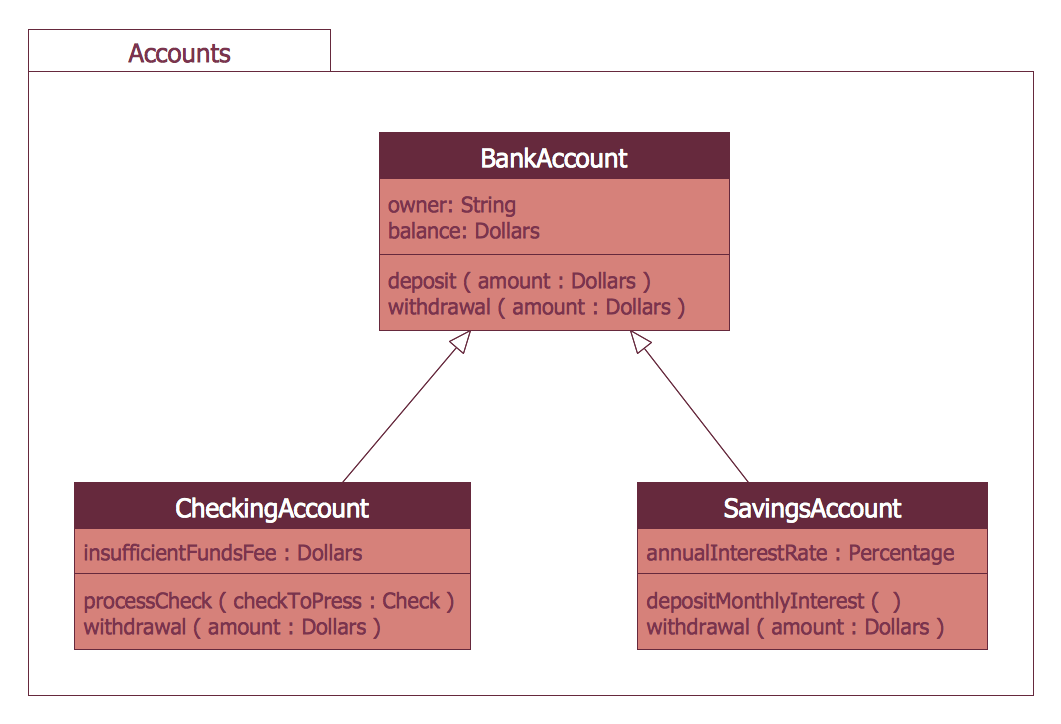
Bank System
A five level pyramid model of different types of Information Systems based on the information processing requirement of different levels in the organization. The first level represents transaction processing systems to process basic data. The second level represents office support systems to process information in office. The third level represents management information systems to process information by managers. The fourth level represents decision support systems to process explicit knowledge. The fifth level represents executive information systems to process tacit knowledge.
"A Computer(-Based) Information System is essentially an IS using computer technology to carry out some or all of its planned tasks. The basic components of computer based information system are:
(1) Hardware - these are the devices like the monitor, processor, printer and keyboard, all of which work together to accept, process, show data and information.
(2) Software - are the programs that allow the hardware to process the data.
(3) Databases - are the gathering of associated files or tables containing related data.
(4) Networks - are a connecting system that allows diverse computers to distribute resources.
(5) Procedures - are the commands for combining the components above to process information and produce the preferred output.
The first four components (hardware, software, database and network) make up what is known as the information technology platform. Information technology workers could then use these components to create information systems that watch over safety measures, risk and the management of data. These actions are known as information technology services." [Information systems. Wikipedia]
This pyramid diagram was redesigned using the ConceptDraw PRO diagramming and vector drawing software from Wikimedia Commons file Five-Level-Pyramid-model.png. [commons.wikimedia.org/ wiki/ File:Five-Level-Pyramid-model.png]
This file is licensed under the Creative Commons Attribution 3.0 Unported license. [creativecommons.org/ licenses/ by/ 3.0/ deed.en]
The triangle chart example "Information systems types" is included in the Pyramid Diagrams solution from the Marketing area of ConceptDraw Solution Park.
Pyramid diagram

Entity Relationship Diagram Symbols

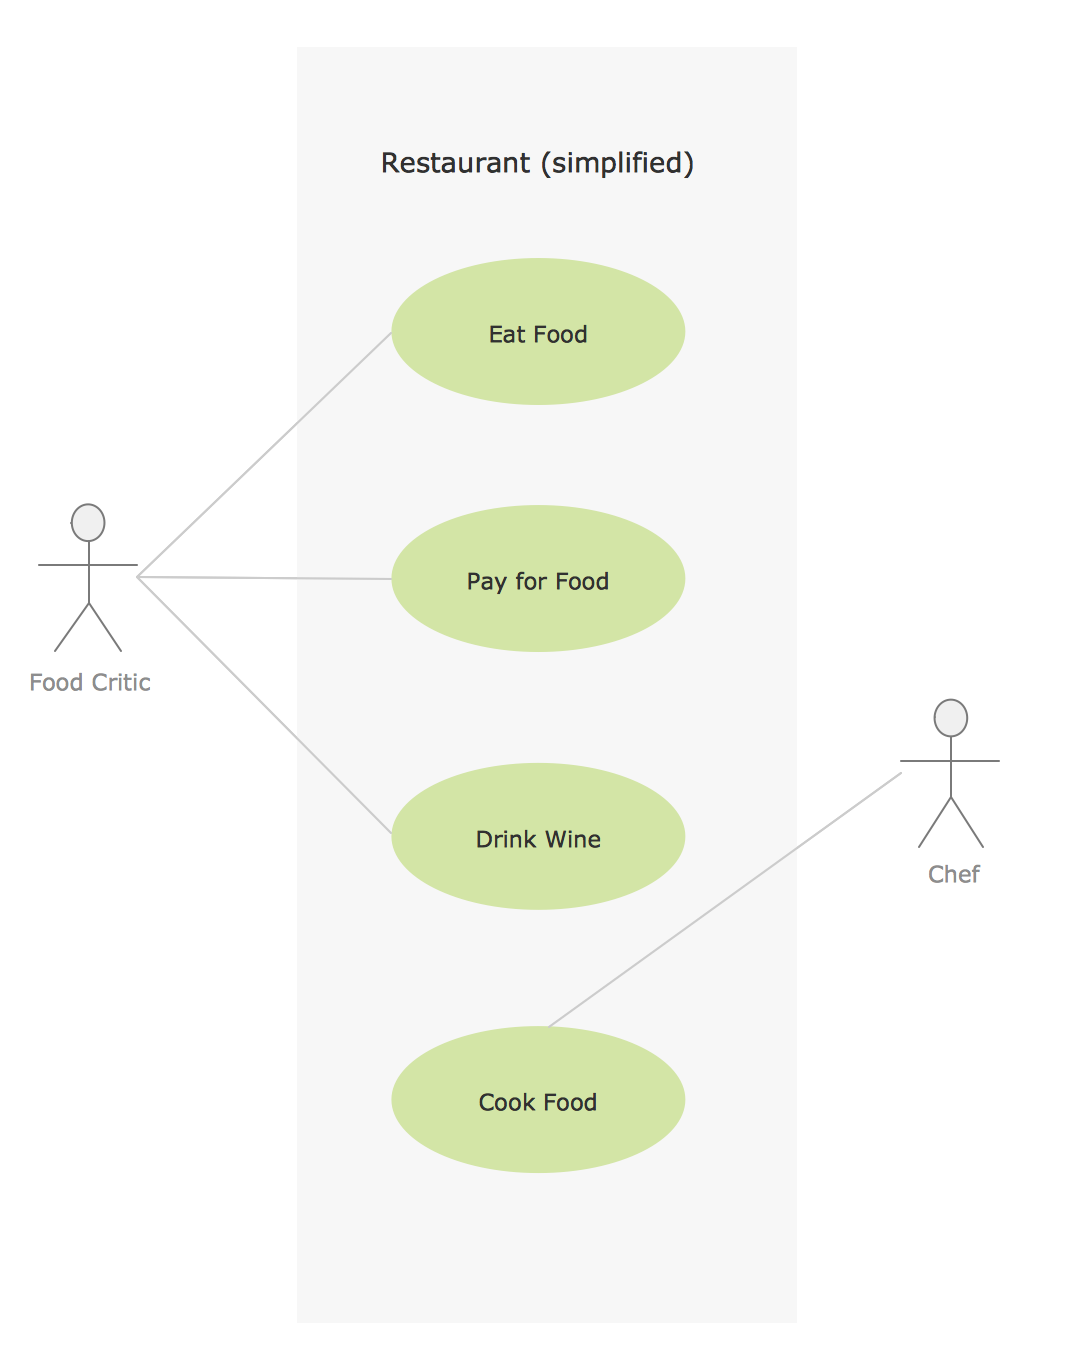
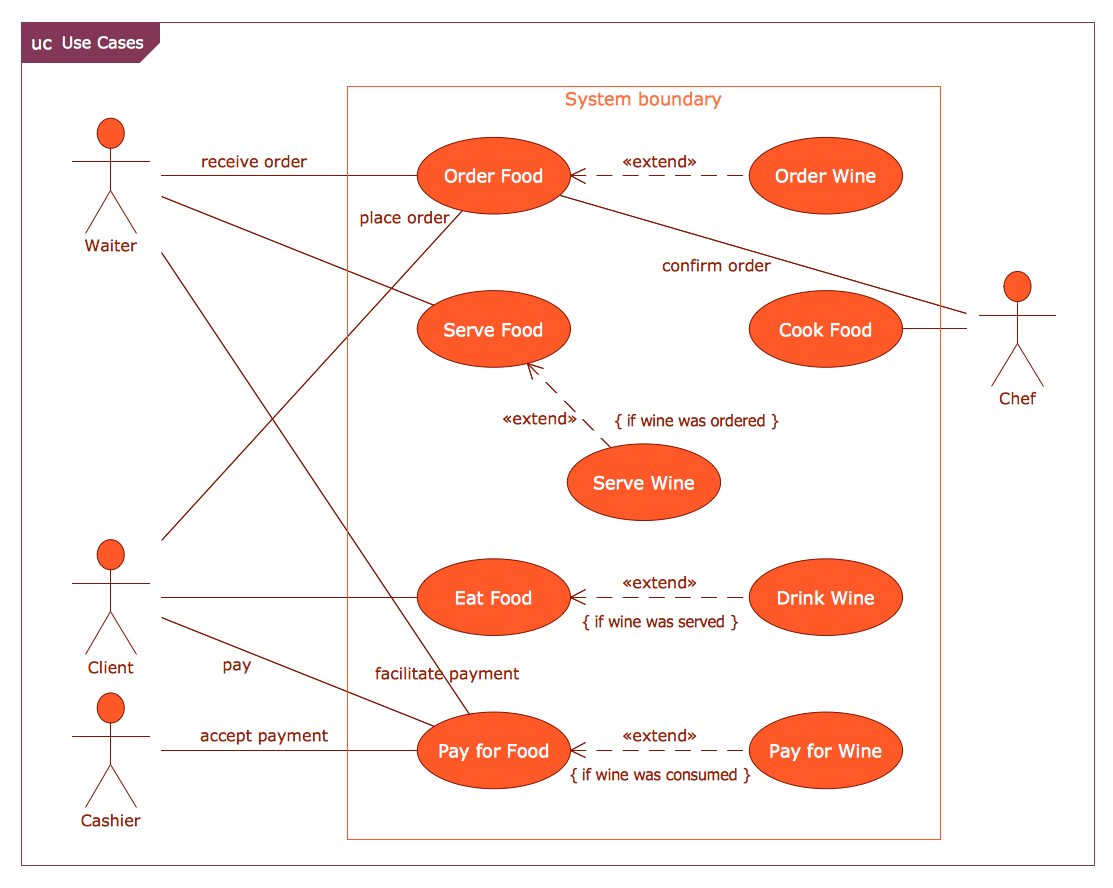
Sample for UML
Pyramid Diagram

Systems Engineering
Taxi Service Data Flow Diagram DFD Example

- Model Based Systems Engineering | Jacobson Use Cases Diagram ...
- Model Based Systems Engineering | Types of Flowcharts | Basic ...
- Bank UML Diagram | ATM UML Diagrams | Model Based Systems ...
- Process Flowchart | Business Process Modeling Resume | Model ...
- Model Based Systems Engineering | FSM — Finite-state Machine ...
- Block diagram - Gap model of service quality | Model Based ...
- Process Flowchart | Model Based Systems Engineering | Types of ...
- Jacobson Use Cases Diagram | Model Based Systems Engineering ...
- Model Based On Lan Wan Man
- UML activity diagram - Cash withdrawal from ATM | Business ...