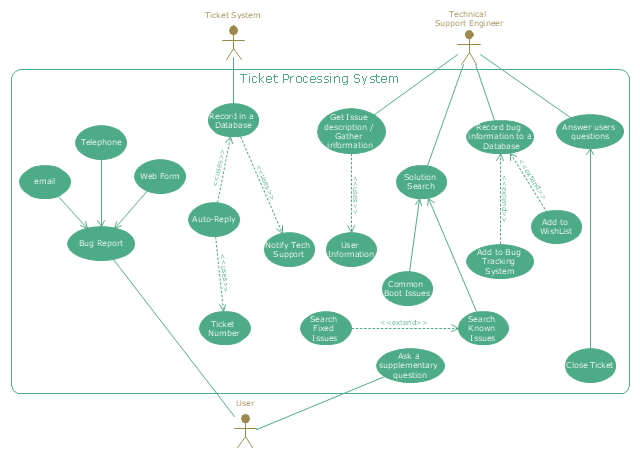
"An example scenario is presented to demonstrate how a common issue tracking system would work:
(1) A customer service technician receives a telephone call, email, or other communication from a customer about a problem. Some applications provide built-in messaging system and automatic error reporting from exception handling blocks.
(2) The technician verifies that the problem is real, and not just perceived. The technician will also ensure that enough information about the problem is obtained from the customer. This information generally includes the environment of the customer, when and how the issue occurs, and all other relevant circumstances.
(3) The technician creates the issue in the system, entering all relevant data, as provided by the customer.
(4) As work is done on that issue, the system is updated with new data by the technician. Any attempt at fixing the problem should be noted in the issue system. Ticket status most likely will be changed from open to pending.
(5) After the issue has been fully addressed, it is marked as resolved in the issue tracking system.
If the problem is not fully resolved, the ticket will be reopened once the technician receives new information from the customer. A Run Book Automation process that implements best practices for these workflows and increases IT personnel effectiveness is becoming very common." [Issue tracking system. Wikipedia]
The UML use case diagram example "Ticket processing system" was created using the ConceptDraw PRO diagramming and vector drawing software extended with the Rapid UML solution from the Software Development area of ConceptDraw Solution Park.
UML use case diagram
 PM Agile
PM Agile solution provides powerful tools for project management, project planning and software development, ensuring support of Agile methods, assisting in holding the Scrum-meetings, collaborative planning sprints, maintaining backlog, calculating and reporting the velocity of the team. Intended for the companies using Agile methodology, specifically Scrum, Product Owners, Scrum Masters, software developers, and management specialists, this solution includes examples demonstrating the main principles of Agile methodology and Scrum, and numerous templates specially developed in ConceptDraw DIAGRAM and ConceptDraw MINDMAP applications. All Agile meetings and documents are powered by the mission of adapted Mind Map templates, tuned for collaborative work of development team. The key diagrams for visualization are made in ConceptDraw DIAGRAM.
Example of DFD for Online Store (Data Flow Diagram) DFD Example


Project —Task Trees and Dependencies

Audit Flowchart Symbols

Scrum

Accounting Flowchart Symbols

Cross-Functional Flowchart


Network Visualization with ConceptDraw PRO

 Audit Flowcharts
Audit flowcharts solution extends ConceptDraw PRO software with templates, samples and library of vector stencils for drawing the audit and fiscal flow charts.
Kanban Board Software

Software Diagrams

 PM Dashboards
The PM Dashboards solution extends the management boundaries of ConceptDraw PRO and ConceptDraw PROJECT products with an ability to demonstrate changes to the budget status, to show the project progress toward its objectives, to display clearly the identified key performance indicator (KPI) or the set of key performance indicators for any project. This solution provides you with examples and ability to generate three types of visual dashboards reports based on your project data Project Dashboard, Tactical Dashboard, and Radar Chart. By dynamically charting the project’s key performance indicators that are collected on one ConceptDraw PRO document page, all project participants, project managers, team members, team leaders, stakeholders, and the entire organizations, for which this solution is intended, have access to the daily status of projects they are involved in.
- Bug Tracking System Project Collaboration Diagram
- Collaboration Diagram For Bug Tracking
- Diagramming Software for Design UML Collaboration Diagrams ...
- Collaboration Diagram Of Bug Tracking System
- Trouble ticket system - BPMN 2.0 diagram | UML Collaboration ...
- Collaboration Diagram For Bug Tracking System
- Diagramming Software for Design UML Communication Diagrams ...
- UML use case diagram - Ticket processing system | UML ...
- Activity Diagram On Bug Tracking System
- Activity Diagram For The Project Bug Tracking System
- Trouble ticket system - BPMN 2.0 diagram | UML sequence diagram ...
- Sequence Diagram For Bug Tracking System
- Activity Diagram For Bug Tracking System
- Use Case Diagram For Bug Tracking System
- Sequence Diagram For Tracking System
- UML Collaboration Diagram (UML2.0) | Diagramming Software for ...
- Issue Tracking System Activity Diagram
- UML use case diagram - Ticket processing system | PM Personal ...
- Trouble ticket system - BPMN 2.0 diagram | UML use case diagram ...
- UML sequence diagram - Ticket processing system | UML sequence ...