 Fishbone Diagrams
The Fishbone Diagrams solution extends ConceptDraw PRO v10 software with the ability to easily draw the Fishbone Diagrams (Ishikawa Diagrams) to clearly see the cause and effect analysis and also problem solving. The vector graphic diagrams produced using this solution can be used in whitepapers, presentations, datasheets, posters, and published technical material.
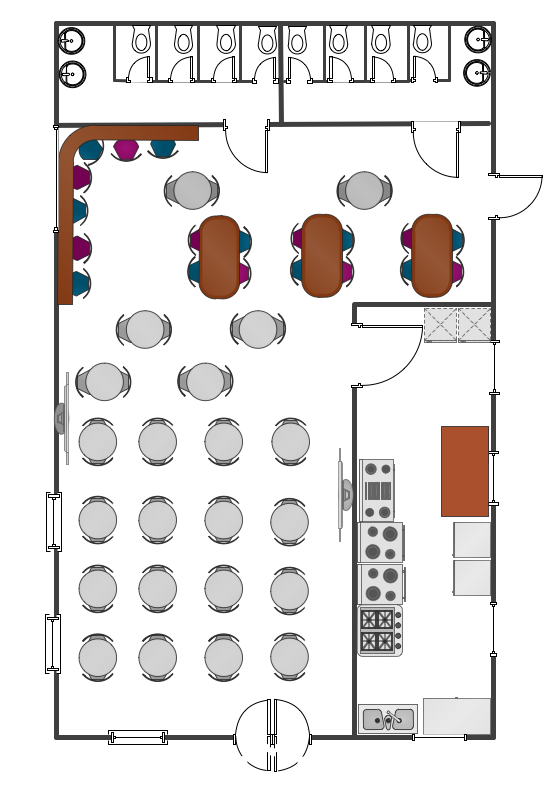
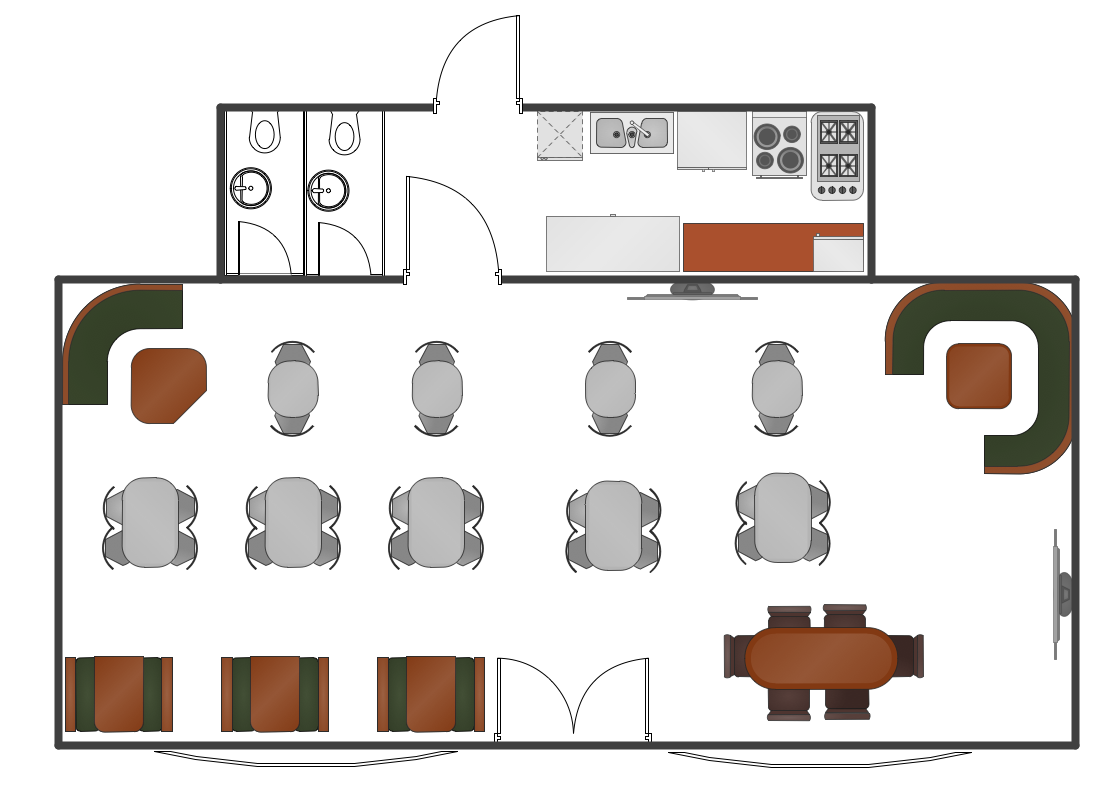
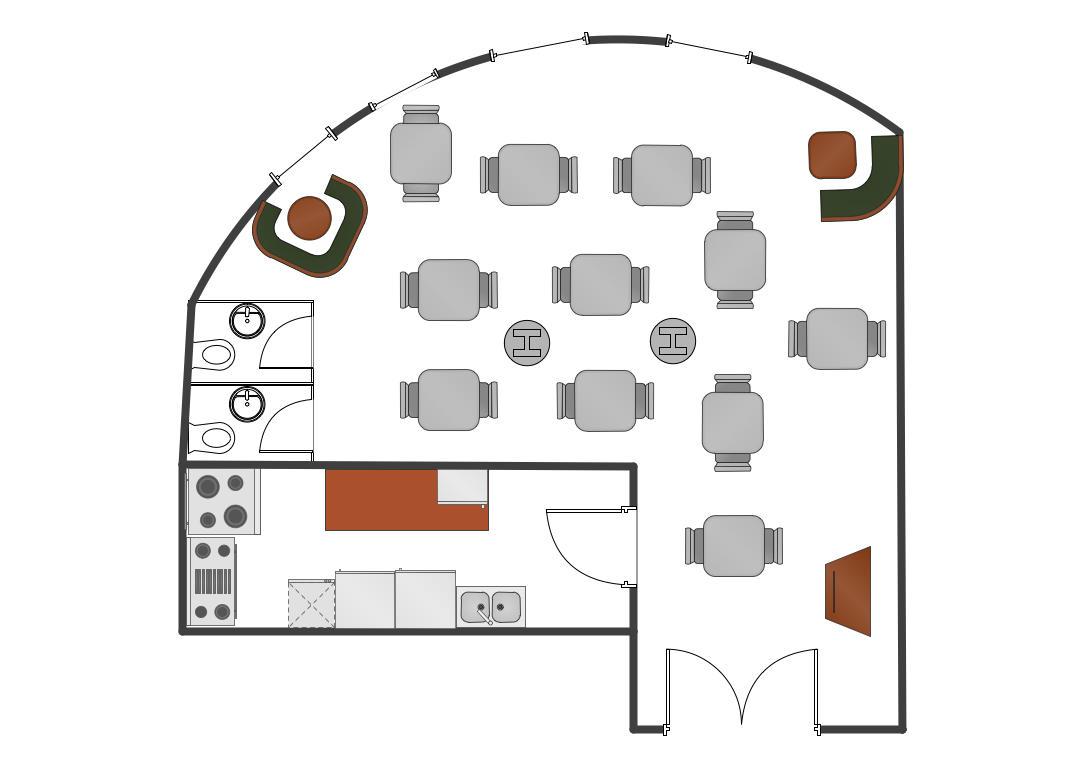
Cafe Floor Plan. Cafe Floor Plan Examples
Cafe is a perfect place for business meetings, romantic rendezvous, friendly leisures, both adults and children, it is a popular place of relaxation and recreation, staying in which delivers many lively emotions, impressions and memories. Therefore, the opening of the adult or children's cafe, Internet cafe, elite or even thematic cafe is a fine business idea. At the same time when opening a cafe, you need consider a number of nuances and undertake important steps - to make a business plan, choose a popular location, create interesting and comfort cafe interior style and design, draw detailed Cafe floor plan, construct the catchy building if it was not built yet, and make the repairs. On these stages you can enlist the help of professionals, architects and designers, either make themselves your own professional-looking Cafe Floor Plans using the ConceptDraw PRO software. Quick start with ready predesigned Cafe floor plans templates, examples or samples, ready-to-use vector symbols that make you instantly productive in drawing Cafe Floor Plans, Cafe Layouts, Cafe Design Plans.How To Create Restaurant Floor Plan in Minutes
Developing Floor Plans, Design Drawings, Plans of Furniture Placement for restaurants and cafes is one of the most responsible and important steps at their construction and designing. Selection of favorable design, the right style of furniture and decors largely determine the success and atmosphere of the institution. The restaurant floor planner ConceptDraw PRO is a perfect choice for architects and designers. Enhanced with Cafe and Restaurant Floor Plans solution it offers a lot of extensive vector symbol libraries and building plan elements for drawing Restaurant floor plans, Restaurant layouts, Restaurant furniture layouts, Cafe floor plans, Bar area floor plan, Fast food restaurant plan, etc. With ConceptDraw PRO you don't need to be an artist to create great-looking restaurant floor plan drawings in minutes, all needed drawing tools are delivered by Building Plans area solutions. Construct your own general plan of restaurant's premises, choose the furniture for your taste from the Cafe and Restaurant Floor Plans solution libraries and arrange it on the plan as you desire fast and easy. ConceptDraw PRO has many of the features found in Visio for Mac such as Drawing, Connection, Shape and Editing Tools.
Café Floor Plan Example
Development and drawing Cafe Layouts and Cafe Floor Plans is the most responsible and important stage at the process of cafe design and construction. On this stage modern architects, constructors and designers prefer apply the special and powerful design applications, which save their time and efforts. ConceptDraw PRO is the best diagramming and design software for drawing most functional and efficient Cafe floor plans, Cafe layouts, Cafe design plans, Restaurant floor plans, etc. ConceptDraw Solution Park includes Cafe and Restaurant Floor Plan solution at the Building Plans area, which offers special drawing tools, ready sample plans and templates for quick-start drawing, and also extensive set of predesigned vector design elements for construction the general plan of cafe, restaurant, or even banquet hall, the plans of arrangement the furniture, appliances and decor elements. Each included Cafe floor plan example or sample is well thought-out and designed by professionals, so can become a good basis or source of inspiration for your own Cafe floor plan.Network Security
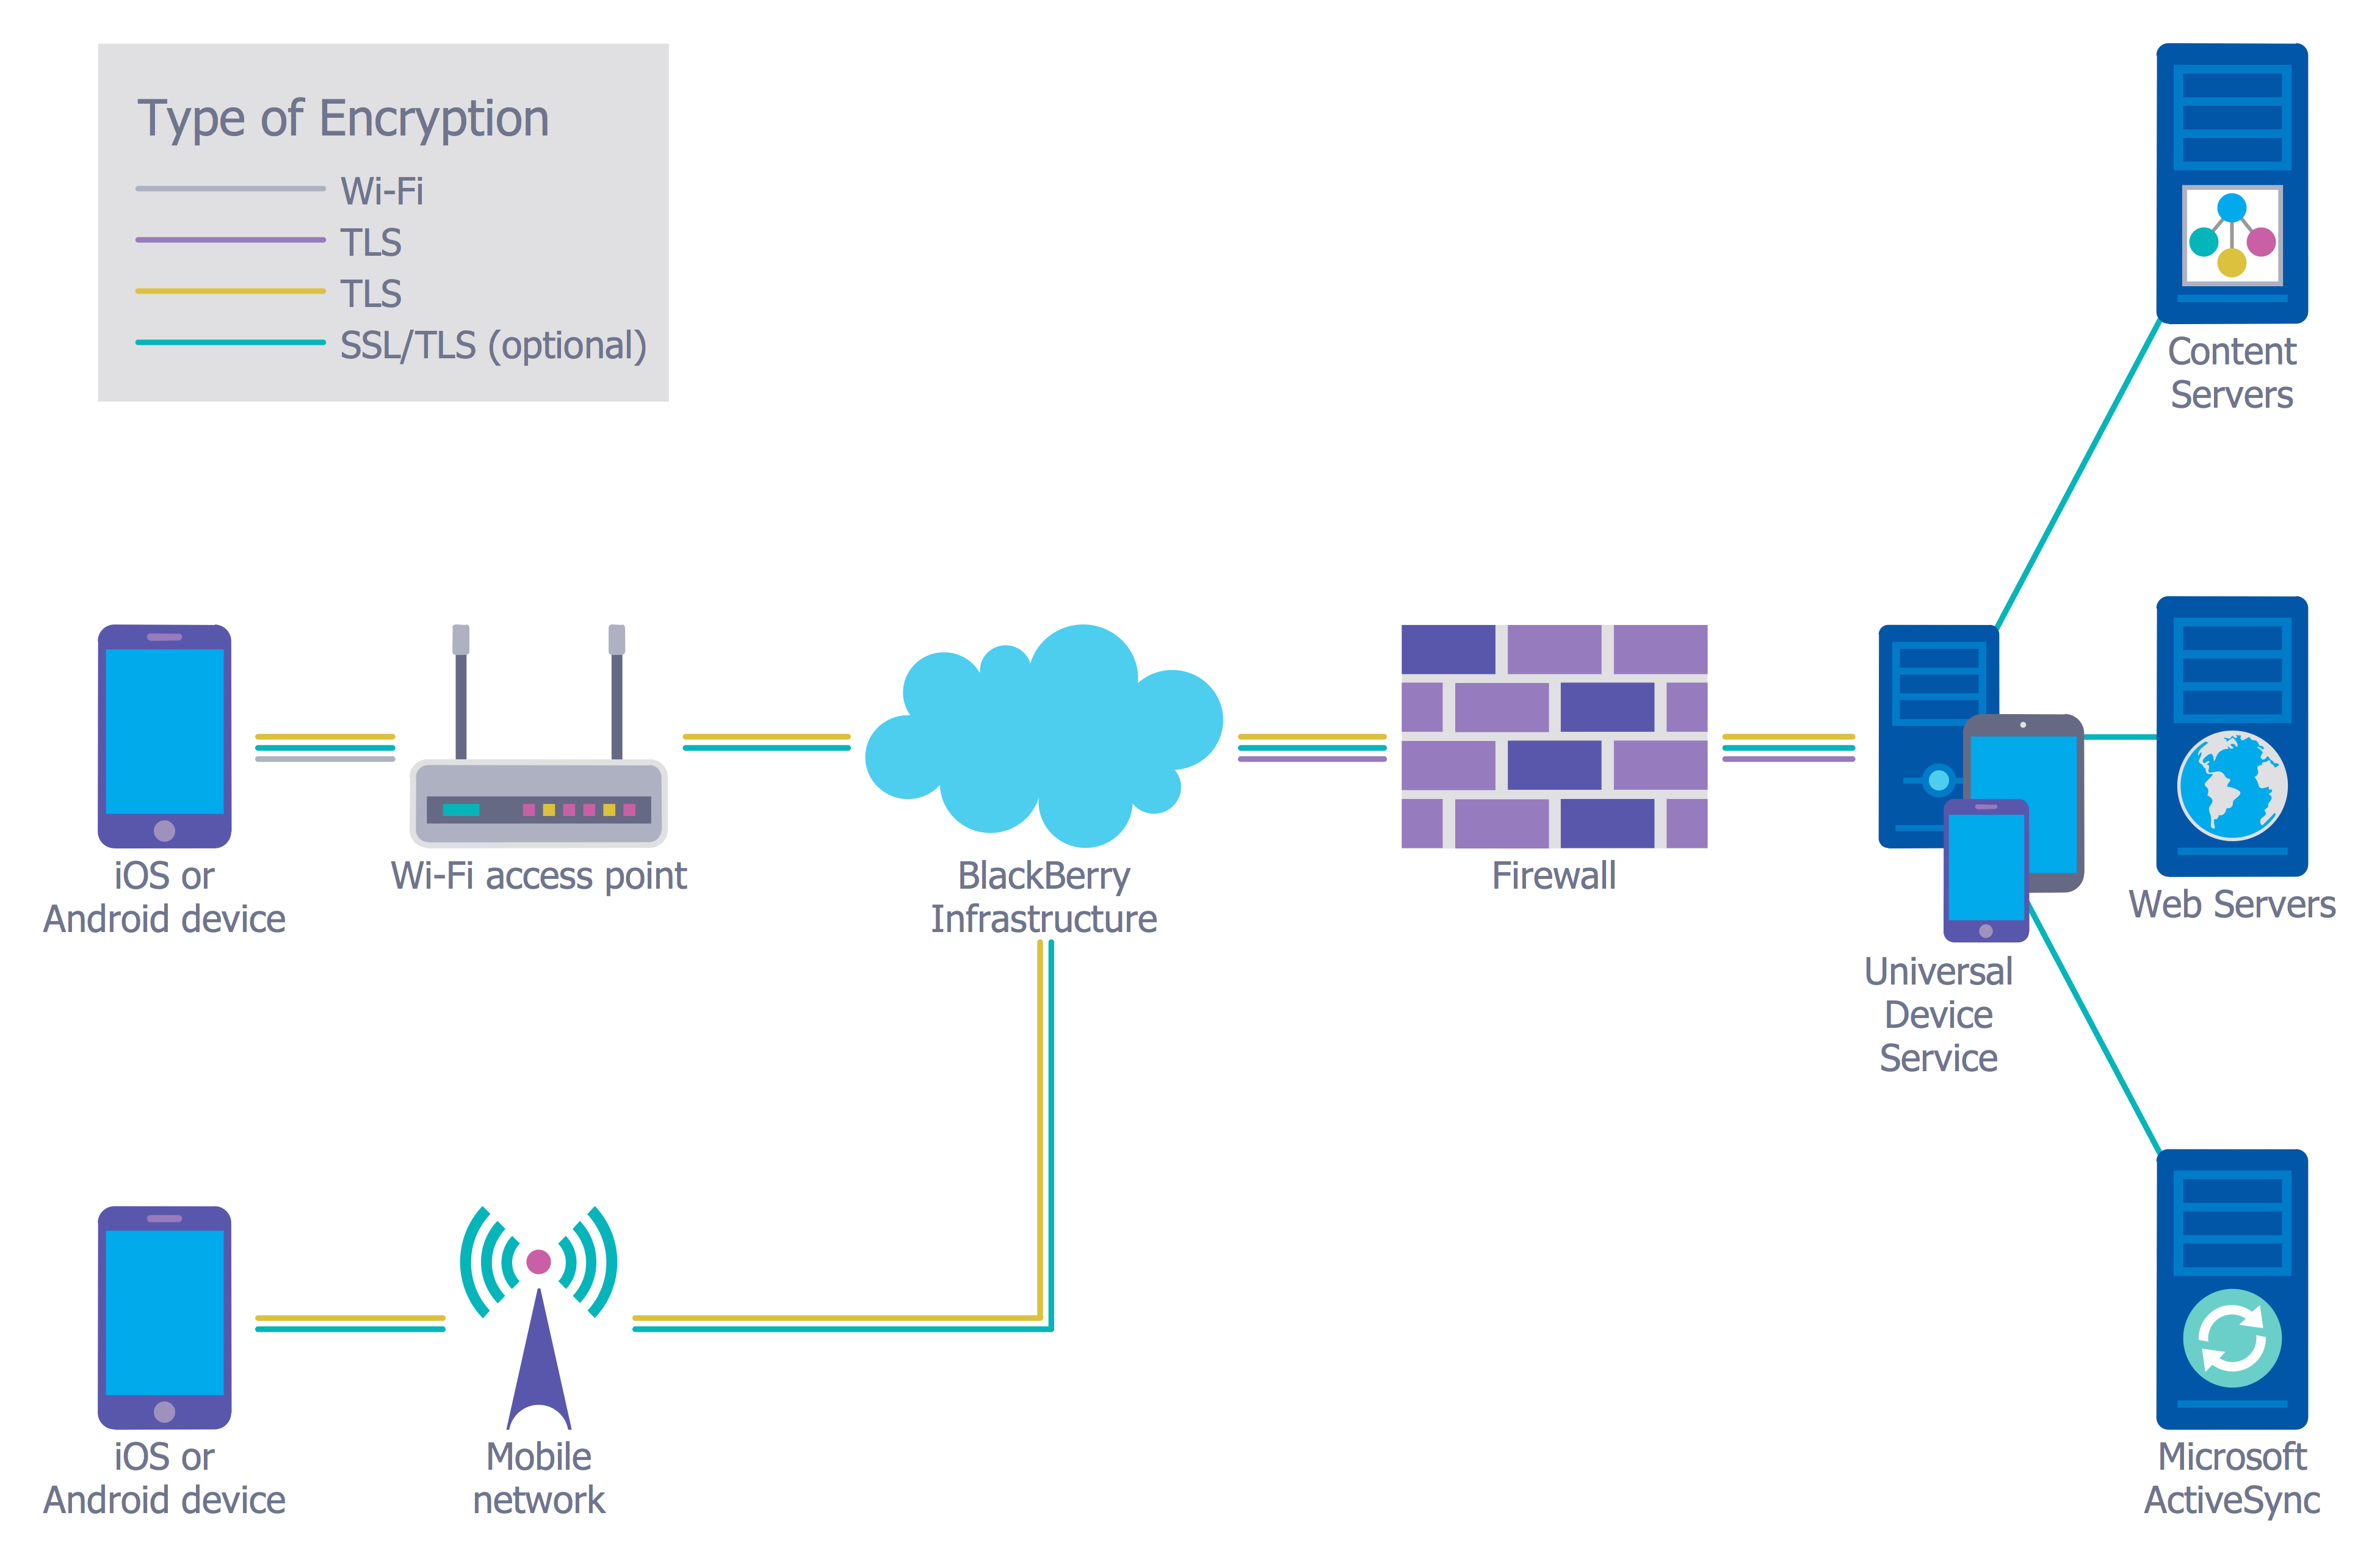
The Internet is a giant computer network which connects computers all over the world. It is integral part of human society and business. But the serious question for network engineers, designers, lawmakers and enforcers is the need for protect the Internet networks from the Internet crimes, hacking and attacks. There are quite a number of hardware, software and physical methods of protection against them. The samples you see on this page were created in ConceptDraw PRO using the tools of Network Security Diagrams Solution for ConceptDraw PRO software. They show protection networks with Firewalls and other network security devices.Restaurant Floor Plans
The restaurant business is considered as one of the most attractive types of investments. This service is characterized by a high level of competition, but at the same time it will be always in demand, the main thing is correctly approach to the question of organization. The making of business plan of the restaurant, cafe or bar with detailed calculations will help to organize effectively this type of activity, to define the goals, to think over the main concept, and to realize the careful planning. The business owner can make its own business plan for the restaurant from the beginning or to find the ready plan and to make the similar or to adjust it in accordance with its specific conditions, requirements and desires. ConceptDraw PRO software and Cafe and Restaurant Plans solution from the ConceptDraw Solution Park provide a lot of samples, templates and vector stencils libraries with ready-made design elements for effective and professional cafe, bar, and restaurant design and restaurant floor plan construction. Use them to achieve a success in restaurant business.Data Flow Diagram
Data Flow Diagram (DFD) is the part of the Structured Systems Analysis and Design Methodology (SSADM), which is intended for information systems projection and analysis. Data Flow Diagrams allow graphically represent the data flows in information system and analyze the data processing during the structural projection. This type of diagrams lets visually show a work of information system and results of this work, it is often used in connection with human processes and can be displayed as Workflow diagram. Data Flow Diagram visualizes processes and functions, external entities, data depositories, and data flows connecting these elements and indicating direction and data character. Each of these elements used for DFD has its own graphical notation. There are two notations to draw DFDs - Yourdon & Coad and Gane & Sarson. ConceptDraw PRO extended with Data Flow Diagrams (DFD) solution from Software Developmant area is ideal for designing professional looking DFDs, which can be then easily exported in various formats.SIPOC Diagram
SIPOC is a tool that summarizes the inputs and outputs of one or more processes in table form. You need to draw professional looking SIPOC Diagram quick and easy? Pay please your attention on ConceptDraw PRO diagramming and vector drawing software. Extended with Business Process Mapping Solution from the Business Processes Area of ConceptDraw Solution Park, it suits ideal for this.Fishbone Diagram Problem Solving
The Ishikawa diagram, Cause and Effect diagram, Fishbone diagram — all they are the names of one and the same visual method for working with causal connections. Originally invented by Kaoru Ishikawa to control the process quality, the Ishikawa diagram is well proven in other fields of management and personal scheduling, events planning, time management. It is a chart in the form of a fish, whose head is a problem, the fins are variants for its causes. To design easily the Fishbone diagram, you can use a special ConceptDraw PRO vector graphic and diagramming software which contains the powerful tools for Fishbone diagram problem solving offered by Fishbone Diagrams solution for the Management area of ConceptDraw Solution Park.
 IDEF Business Process Diagrams
Use the IDEF Business Process Diagrams solution to create effective database designs and object-oriented designs, following the integration definition methodology.
- Cafe and Restaurant Floor Plans | Business Plan Coffee Shop Pdf
- Free Coffee Shop Floor Plans
- Cafe and Restaurant Floor Plans | SWOT analysis for a small ...
- What Are The Requirements And Layouts Of A Small Coffee Shop
- Which Topology Is Suitable For Internet Cafe
- Plant Layout Plans | How to Create a Plant Layout Design | Plant ...
- Earthquake disaster assessment - Workflow diagram | Cloud clipart ...
- Coffee Cup Design
- Swim Lane Diagrams | Swim Lane Flowchart Symbols | Cross ...
- Office pictograms - Vector stencils library | Cafe Floor Plan Design ...


