Cross-Functional Flowchart


Flow chart Example. Warehouse Flowchart


Sales Process Flowchart. Flowchart Examples

Chart Audit

 Block Diagrams
Block diagrams solution extends ConceptDraw PRO software with templates, samples and libraries of vector stencils for drawing the block diagrams.
Easy Flowchart Program and Standard Flowchart Symbols

SWOT analysis matrix diagram templates

Visualize Stakeholder Analysis

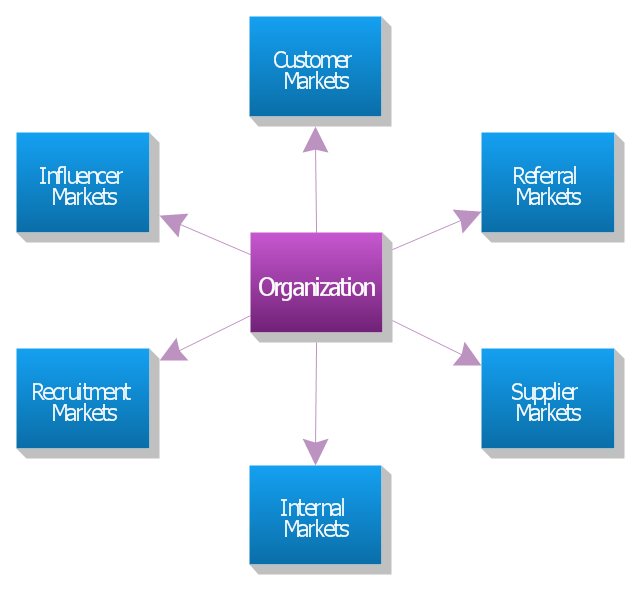
"The six markets model.
Christopher, Payne and Ballantyne (1991) from Cranfield University goes further. They identify six markets which they claim are central to relationship marketing. They are: internal markets, supplier markets, recruitment markets, referral markets, influence markets, and customer markets.
Referral marketing is developing and implementing a marketing plan to stimulate referrals. Although it may take months before you see the effect of referral marketing, this is often the most effective part of an overall marketing plan and the best use of resources.
Marketing to suppliers is aimed at ensuring a long-term conflict-free relationship in which all parties understand each other's needs and exceed each other's expectations. Such a strategy can reduce costs and improve quality.
Influence markets involve a wide range of sub-markets including: government regulators, standards bodies, lobbyists, stockholders, bankers, venture capitalists, financial analysts, stockbrokers, consumer associations, environmental associations, and labor associations. These activities are typically carried out by the public relations department, but relationship marketers feel that marketing to all six markets is the responsibility of everyone in the organization. Each market may require its own explicit strategies and a separate marketing mix for each." [Relationship marketing. Wikipedia]
The block diagram example "Six markets model" was created using the ConceptDraw PRO diagramming and vector drawing software extended with the Block Diagrams solution from the area "What is a Diagram" of ConceptDraw Solution Park.
Block diagram
Audit Process Flowchart. Audit Flowchart

- Audit Flowcharts | Claim Processing Flow Chart
- Medical Claims Process Chart
- Audit flowchart - Claim data processing | Data Processing Flow Chart
- Order processing - EPC flow chart | Audit flowchart - Claim data ...
- Claims Adjudication Process Flow Chart
- How to Create a Cross Functional Flow Chart | Audit flowchart ...
- Claim Process Flow Chart
- Audit Flowcharts | Basic Audit Flowchart. Flowchart Examples | Audit ...
- How to Create a Data Flow Diagram using ConceptDraw PRO | Data ...
- Chart Audit | Audit Process Flowchart. Audit Flowchart | Flow chart ...