This site uses cookies. By continuing to browse the ConceptDraw site you are agreeing to our Use of Site Cookies.

entity-relationship diagram, ER-diagram, database ERD Entity-Relationship Diagram (ERD)

entity-relationship diagram, ER-diagram, database ERD
An Entity-Relationship Diagram (ERD) is a visual presentation of entities and relationships. That type of diagrams is often used in the semi-structured or unstructured data in databases and information systems. At first glance ERD is similar to a flowch
HelpDesk

How to Create an Entity-Relationship Diagram

ERD (entity relationship diagram) is used to show the logical structure of databases. It represents the interrelationships between components of a database (entities). Entity relationship diagrams are widely used in software engineering. Using ERD software engineers can control every aspect of database development. ER diagram can be used as a guide for testing and communicating before the release of the software product. ERD displays data as entities that are connected with connections that show the relationships between entities. There are some ERD notations used by databases developers for representing the relationships between the data objects. ConceptDraw DIAGRAM and its ERD solution allow you to build ERD diagram of any notation.

Simple Diagramming

Create flowcharts, org charts, floor plans, business diagrams and more with ConceptDraw DIAGRAM.

How to Draw ER Diagrams

How to Draw ER Diagrams? With Entity-Relationship Diagram (ERD) solution from the Software Development Area for ConceptDraw Solution Park you are able to draw ER diagram with no problem. It includes 45 predesigned icons advocated by popular Chen's and Crow’s Foot notations that can be used when describing an enterprise database.

Flowchart

With ConceptDraw DIAGRAM it is easy to create professional flowchart diagrams of any complexity. With the use of numerous templates and the extensive libraries of ready-made symbols and blocks; depicting your business processes has never been easier.

Best Multi-Platform Diagram Software

ConceptDraw DIAGRAM is a powerful tool for drawing business communication ideas and concepts, simple visual presentation of numerical data in the Mac environment.

Block Diagram

The vector stencils libraries: Block Diagrams, Blocks with Perspective, Callouts, Connectors, Raised Blocks from the solution Block Diagrams contain specific block diagram symbols such as arrows, input/output symbols, start/end symbols, processing symbols, conditional symbols, commenting symbols, callouts, connectors, etc. for ConceptDraw DIAGRAM diagramming and vector drawing software. The Block Diagrams solution is contained in a "Diagrams" area of ConceptDraw Solution Park.
Use the libraries from the Block Diagrams solution to draw block diagrams for your business documents, presentations and websites in a few minutes.

interactive voice response system, IVR Interactive Voice Response Diagrams

interactive voice response system, IVR
Interactive Voice Response Diagrams solution extends ConceptDraw DIAGRAM software with samples, templates and libraries of ready-to-use vector stencils that help create Interactive Voice Response (IVR) diagrams illustrating in details a work of interactive voice response system, the IVR system’s logical and physical structure, Voice-over-Internet Protocol (VoIP) diagrams, and Action VoIP diagrams with representing voice actions on them, to visualize how the computers interact with callers through voice recognition and dual-tone multi-frequency signaling (DTMF) keypad inputs.

fault tree analysis, fishbone diagram, cause and effect diagrams, fault tree analysis software, fault tree analysis example Fault Tree Analysis Diagrams

fault tree analysis, fishbone diagram, cause and effect diagrams, fault tree analysis software, fault tree analysis example
This solution extends ConceptDraw DIAGRAM.5 or later with templates, fault tree analysis example, samples and a library of vector design elements for drawing FTA diagrams (or negative analytical trees), cause and effect diagrams and fault tree diagrams.

metro maps, subway map, mta subway map, metro train map, metro path map, subway train map Metro Map

metro maps, subway map, mta subway map, metro train map, metro path map, subway train map
Metro Map solution extends ConceptDraw DIAGRAM software with templates, samples and library of vector stencils for drawing the metro maps, route maps, bus and other transport schemes, or design tube-style infographics.
HelpDesk

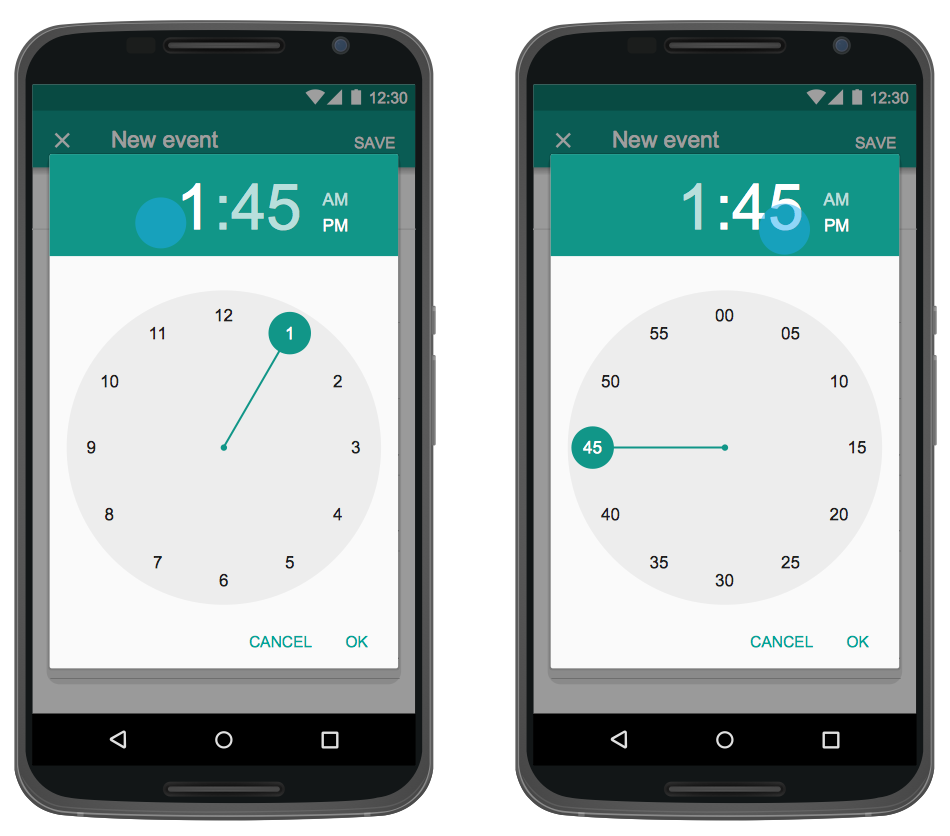
How to Design an Interface Mock-up of an Android Application

Uses Interface prototyping is much convenient when you can work through a diagram similar to the device design. ConceptDraw DIAGRAM allows you to develop Android User Interface (UI) prototypes using the special templates and vector libraries of the specific user interface elements. Using ConceptDraw DIAGRAM you can mock-up an Android UI system so that you can figure out how best to represent user interface (UI) elements for the development of a new mobile Apps.
HelpDesk

How to Develop Website Wireframes

Website design is a rather complicated process. The development of a website wireframe is an important step in any screen design process. The first step of this process before coding can start, web designer creates a website wireframe — a mock-up for what will be displayed on the screen when navigating through the web site pages. A wireframe design always includes three components:Information design, navigation design and interface design. The configuration of these components depends on the business model of the website. The Website Wireframing tools provided with ConceptDraw Website Wireframe solution helps to define the information hierarchy of website design, making it easier for web-developers to plan the layout according to how a site visitor have to process the information.
HelpDesk

How to Design an Interface Mockup for iPhone Application

The Apple iPhone user interface has become something of a standard for smartphones, and mobile devices in general. A well-designed user interface (UI) is very important for user-friendly navigation and the best correlation with operating system logic. Development of successful iPhone App UI requires a planning and prototyping stage. An iPhone UI diagram can be employed to give a general view of the device's screen, upon which elements can be placed and re-arranged as necessary. Using ConceptDraw DIAGRAM you can mock-up an iPhone UI system so that you can figure out how best to represent user interface (UI) elements for the development of a new iPhone App.

Diagramming Software for Design UML Timing Diagrams

UML Timing Diagram as special form of a sequence diagram are used to explore the behaviors of objects throughout a given period of time.
HelpDesk

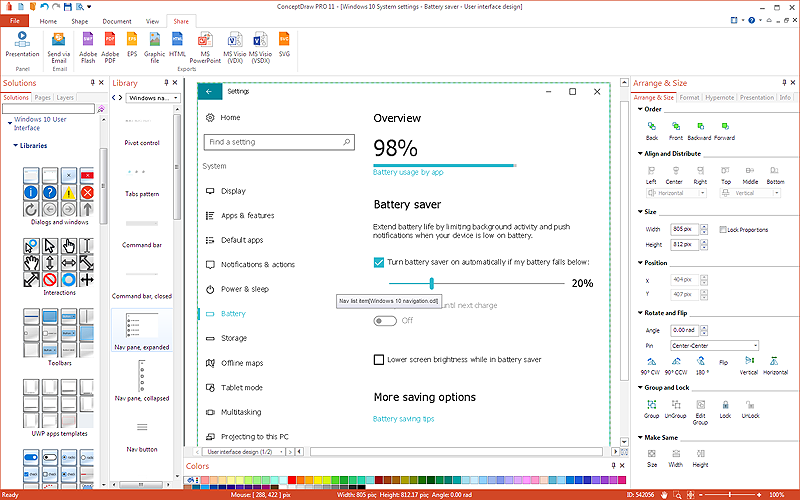
How to Design a Mockup of Windows 10 User Interface

The launch of Windows 10 with its the tile-based UI design brings a lot of new opportunities for both designers and developers to build new apps. To design an effective user interface, graphic designers will create visual Graphic User Interface (GUI) prototypes, that focus on maximizing the user experience — searching for the most functional layout that attends to core user needs, while retaining an appropriate aesthetic. It is important to know how the user will interact with the UI, and how functionality and appearance will change, depending on the features being used at any one time. The Modern UI design style has its own unique principles and typography that can be managed using ConceptDraw DIAGRAM. The ability to design Windows 10 User Interface is delivered by the Windows 10 User Interface solution for ConceptDraw DIAGRAM.