 Circular Arrows Diagrams
Circular Arrows Diagrams solution extends ConceptDraw PRO v10 with extensive drawing tools, predesigned samples, Circular flow diagram template for quick start, and a library of ready circular arrow vector stencils for drawing Circular Arrow Diagrams, Segmented Cycle Diagrams, and Circular Flow Diagrams. The elements in this solution help managers, analysts, business advisers, marketing experts, scientists, lecturers, and other knowledge workers in their daily work.
HelpDesk
How to Draw a Circular Arrows Diagram Using ConceptDraw PRO

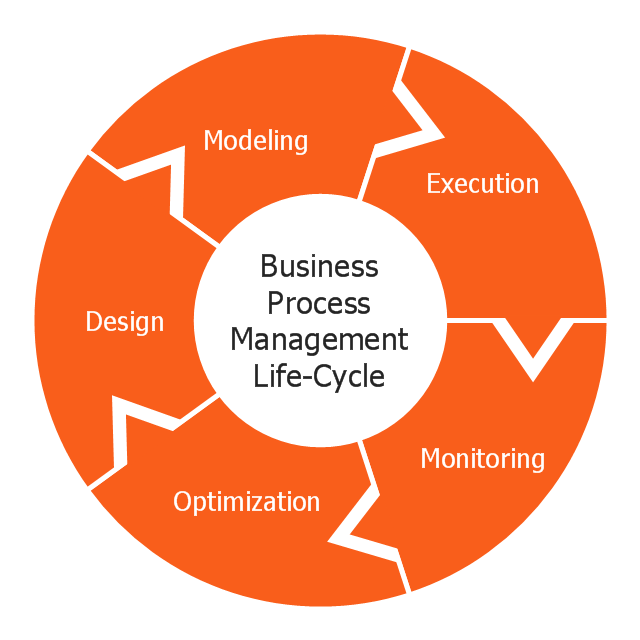
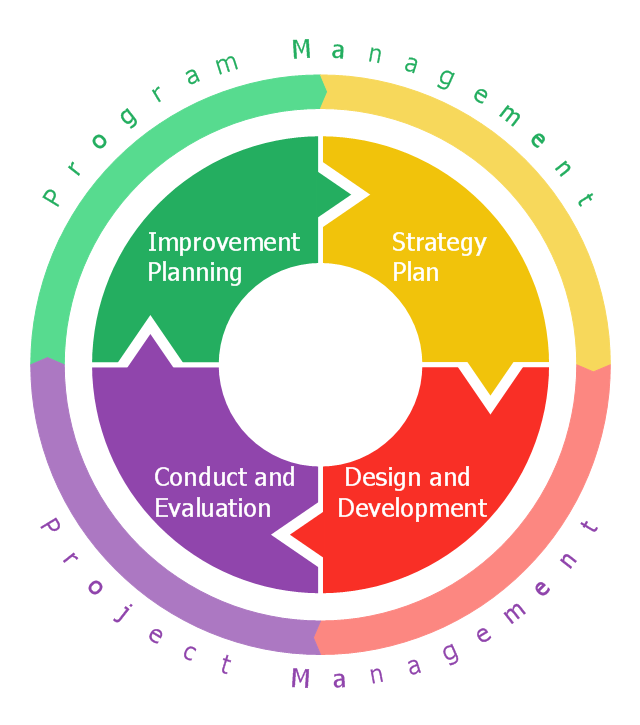
"BPM life-cycle.
Business process management activities can be grouped into six categories: vision, design, modeling, execution, monitoring, and optimization.
Functions are designed around the strategic vision and goals of an organization. Each function is attached with a list of processes. Each functional head in an organization is responsible for certain sets of processes made up of tasks which are to be executed and reported as planned. Multiple processes are aggregated to function accomplishments and multiple functions are aggregated to achieve organizational goals." [Business process management. Wikipedia]
This business process management life cycle diagram example was redesigned using the ConceptDraw PRO diagramming and vector drawing software from the Wikipedia file: Business Process Management Life-Cycle.svg. [en.wikipedia.org/ wiki/ File:Business_ Process_ Management_ Life-Cycle.svg]
This file is licensed under the Creative Commons Attribution-Share Alike 3.0 Unported license. [creativecommons.org/ licenses/ by-sa/ 3.0/ deed.en]
The circular arrows diagram example "BPM life cycle" is included in the Circular Arrows Diagrams solution from the area "What is a Diagram" of ConceptDraw Solution Park.
Circular arrows diagram
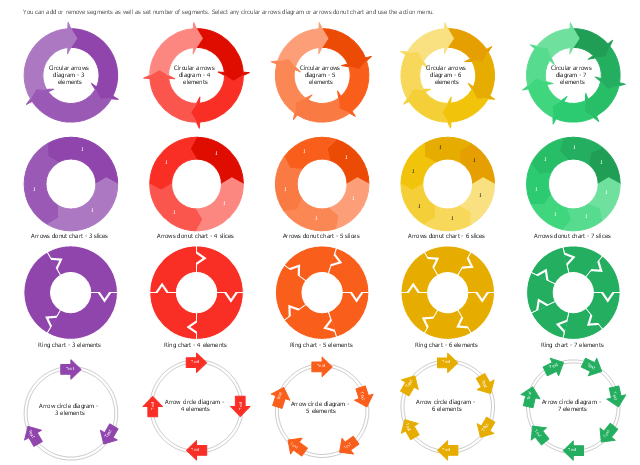
The vector stencils library "Circular arrows diagrams" contains 18 templates of circular arrows diagrams and arrow donut charts for the ConceptDraw PRO diagramming and vector drawing software.
Circular Arrows Diagrams (Segmented Cycle Diagrams) visualize a sequence of steps, tasks, or events as a circular flow. They are used to visualize a processing cycle in marketing and management documents and presentations.
The example "Design elements - Circular arrows diagrams" is included in the Circular Arrows Diagrams solution from the area "What is a Diagram" of ConceptDraw Solution Park.
Circular arrows diagrams
The vector stencils library "Circular arrows diagrams" contains 18 templates of circular arrows diagrams and arrow donut charts.
Use these shapes to draw your circular arrows diagrams in the ConceptDraw PRO diagramming and vector drawing software extended with the Circular Arrows Diagrams solution from the area "What is a Diagram" of ConceptDraw Solution Park.
Use these shapes to draw your circular arrows diagrams in the ConceptDraw PRO diagramming and vector drawing software extended with the Circular Arrows Diagrams solution from the area "What is a Diagram" of ConceptDraw Solution Park.
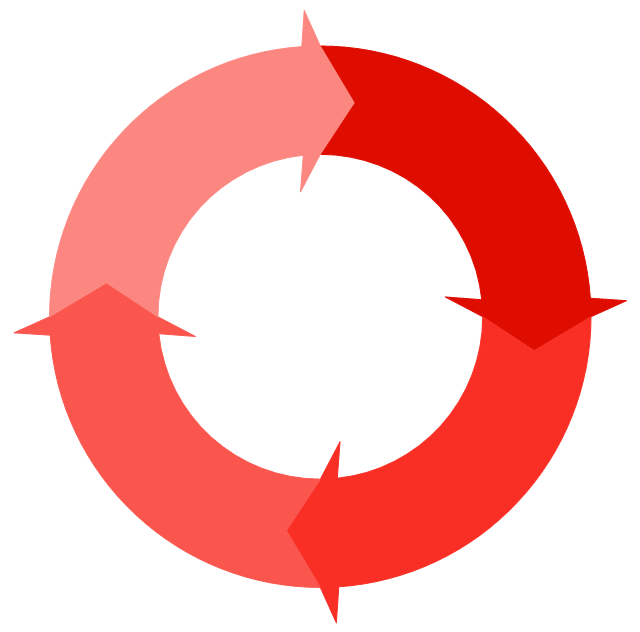
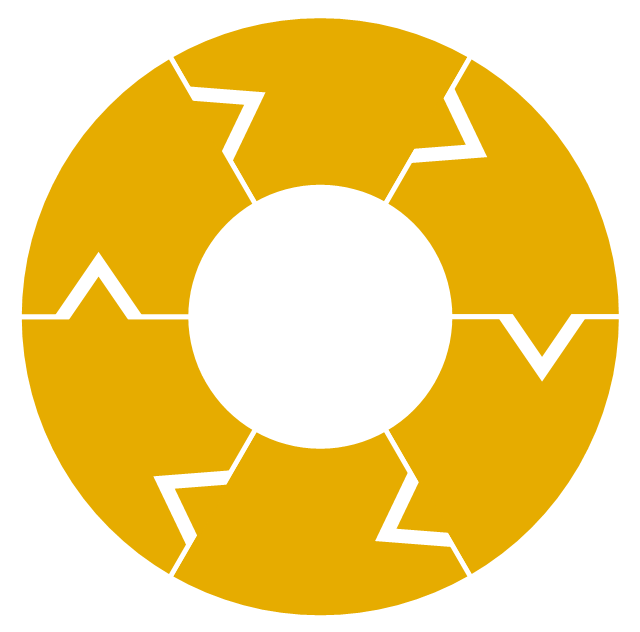
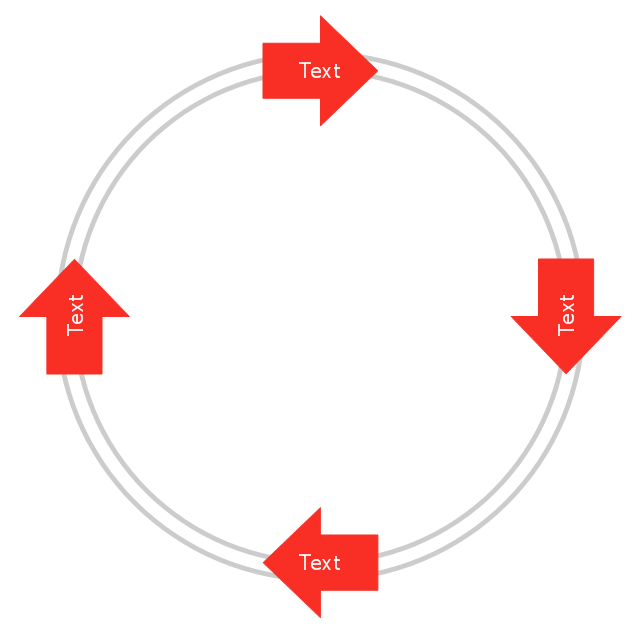
Circular arrows diagram - red

Circular arrows diagram - orange
Circular arrows diagram - yellow

Circular arrows diagram - green

Circular arrows diagram - aquamarine

Circular arrows diagram - blue
Circular arrows diagram - dark blue
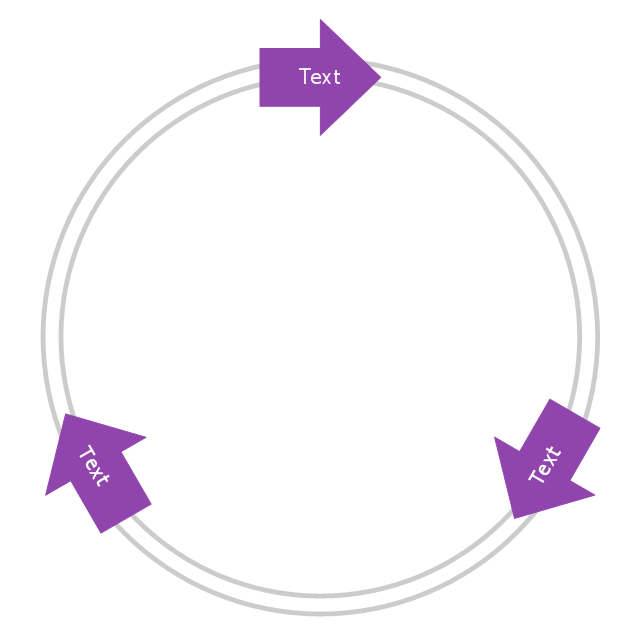
Circular arrows diagram - violet
Circular arrows diagram - magenta
Arrows donut chart - red
Arrows donut chart - orange

Arrows donut chart - yellow

Arrows donut chart - green

Arrows donut chart - aquamarine
Arrows donut chart - blue

Arrows donut chart - dark blue
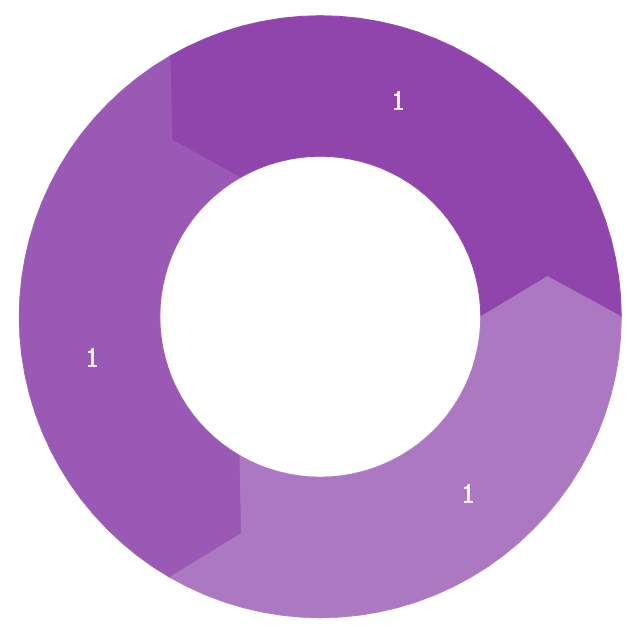
Arrows donut chart - violet
Arrows donut chart - magenta
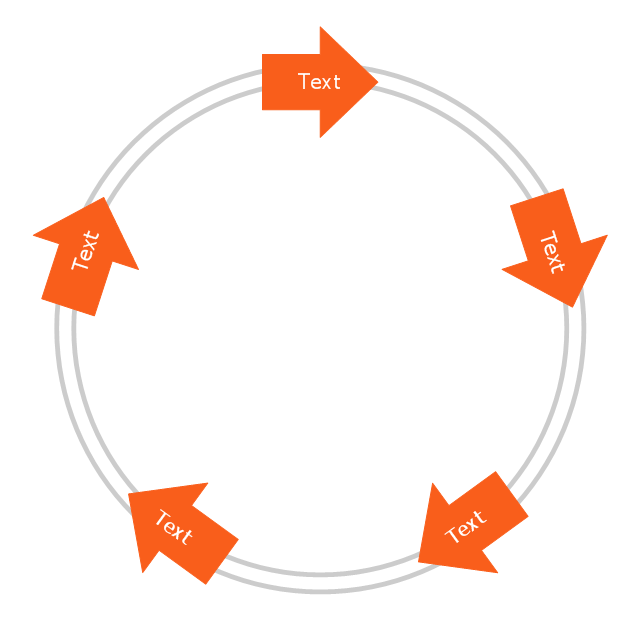
Circular Arrows Diagrams (Segmented Cycle Diagrams) visualize a sequence of steps, tasks, or events as a circular flow. They are used to visualize a processing cycle in marketing and management documents and presentations.
The circular arrows diagram template for the ConceptDraw PRO diagramming and vector drawing software is included in the Circular Arrows Diagrams solution from the area "What is a Diagram" of ConceptDraw Solution Park.
The circular arrows diagram template for the ConceptDraw PRO diagramming and vector drawing software is included in the Circular Arrows Diagrams solution from the area "What is a Diagram" of ConceptDraw Solution Park.
Circular arrows diagram template
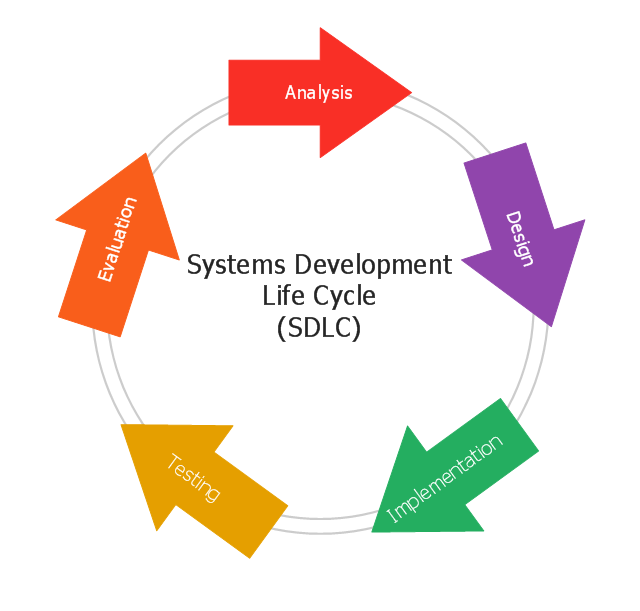
"The systems development life cycle (SDLC), also referred to as the application development life-cycle, is a term used in systems engineering, information systems and software engineering to describe a process for planning, creating, testing, and deploying an information system. The systems development life-cycle concept applies to a range of hardware and software configurations, as a system can be composed of hardware only, software only, or a combination of both." [Systems development life-cycle. Wikipedia]
The circular arrows diagram example "SDLC" was created using the ConceptDraw PRO diagramming and vector drawing software extended with the Circular Arrows Diagrams solution from the area "What is a Diagram" of ConceptDraw Solution Park.
The circular arrows diagram example "SDLC" was created using the ConceptDraw PRO diagramming and vector drawing software extended with the Circular Arrows Diagrams solution from the area "What is a Diagram" of ConceptDraw Solution Park.
Circular arrows diagram
"PDCA (plan–do–check–act or plan–do–check–adjust) is an iterative four-step management method used in business for the control and continuous improvement of processes and products. It is also known as the Deming circle/ cycle/ wheel, Shewhart cycle, control circle/ cycle, or plan–do–study–act (PDSA). Another version of this PDCA cycle is OPDCA. The added "O" stands for observation or as some versions say "Grasp the current condition." This emphasis on observation and current condition has currency with Lean manufacturing/ Toyota Production System literature." [PDCA. Wikipedia]
The circular arrows diagram example "PDCA cycle" was created using the ConceptDraw PRO diagramming and vector drawing software extended with the Circular Arrows Diagrams solution from the area "What is a Diagram" of ConceptDraw Solution Park.
The circular arrows diagram example "PDCA cycle" was created using the ConceptDraw PRO diagramming and vector drawing software extended with the Circular Arrows Diagrams solution from the area "What is a Diagram" of ConceptDraw Solution Park.
Circular arrows diagram

 ConceptDraw Solution Park
ConceptDraw Solution Park collects graphic extensions, examples and learning materials
The vector stencils library "Circular diagrams" contains 42 templates of circular diagrams: circular arrow diagram, circular motion diagram, arrow ring chart, doughnut chart (donut chart), circle pie chart, diamond pie chart, circle diagram, pie chart, ring chart, loop diagram, block loop diagram, arrow loop circle, crystal diagram, triangular diagram, diamond diagram, pentagon diagram, hexagon diagram, heptagon diagram, cycle diagram (cycle chart), stacked Venn diagram (onion diagram), arrow circle diagram.
Use these shapes to illustrate your marketing and sales documents, presentations, webpages and infographics in the ConceptDraw PRO diagramming and vector drawing software extended with the Target and Circular Diagrams solution from the Marketing area of ConceptDraw Solution Park.
www.conceptdraw.com/ solution-park/ marketing-target-and-circular-diagrams
Circular arrow diagram 1
Circular arrow diagram 2
Arrow ring chart
Doughnut chart

Diamond pie chart

Pie chart

Circle diagram

Circle pie chart 2

Circle pie chart 1

Ring chart 1 - 3 elements

Ring chart 1 - 4 elements

Ring chart 1 - 5 elements

Ring chart 1 - 6 elements

Ring chart 1 - 7 elements

Ring chart 2 - 3 elements

Ring chart 2 - 4 elements

Ring chart 2 - 5 elements

Ring chart 2 - 6 elements

Ring chart 2 - 7 elements

Crystal diagram - 3 elements

Crystal diagram - 4 elements

Crystal diagram - 5 elements

Crystal diagram - 6 elements

Crystal diagram - 7 elements

Stacked Venn diagram - 4

Stacked Venn diagram - 5

Stacked Venn diagram - 6

Stacked Venn diagram - 7

Basic loop diagram

Block loop diagram

Arrow loop circle
Arrow loop - 3 circles
Arrow loop - 4 circles
Arrow loop - 5 circles
Arrow loop - 6 circles
Arrow loop - 7 circles
Arrow circle diagram - 3
Arrow circle diagram - 4
Stacked Venn diagram - 3

Arrow circle diagram - 5
Arrow circle diagram - 6
Arrow circle diagram - 7
 Circle-Spoke Diagrams
Examples of subject areas that are well suited to this approach are marketing, business, products promotion, process modeling, market, resource, time, and cost analysis. Circle-Spoke Diagrams are successfully used in presentations, conferences, management documents, magazines, reportages, reviews, reports, TV, and social media.
 Basic Diagramming
This solution extends ConceptDraw PRO software with the specific tools you need to easily draw flowcharts, block diagrams, histograms, pie charts, divided bar diagrams, line graphs, circular arrows diagrams, Venn diagrams, bubble diagrams and concept maps
 Target and Circular Diagrams
This solution extends ConceptDraw PRO software with samples, templates and library of design elements for drawing the Target and Circular Diagrams.


This arrow circle diagram sample was redesigned from the Wikimedia Commons file: Loyalitätskreislauf-klein.jpg. [commons.wikimedia.org/ wiki/ File:Loyalit%C3%A4tskreislauf-klein.jpg]
This file is licensed under the Creative Commons Attribution-Share Alike 3.0 Unported license. [creativecommons.org/ licenses/ by-sa/ 3.0/ deed.en]
"Loyalty marketing is an approach to marketing, based on strategic management, in which a company focuses on growing and retaining existing customers through incentives. Branding, product marketing and loyalty marketing all form part of the customer proposition - the subjective assessment by the customer of whether to purchase a brand or not based on the integrated combination of the value they receive from each of these marketing disciplines.
The discipline of customer loyalty marketing has been around for many years...
In recent years, a new marketing discipline called "customer advocacy marketing" has been combined with or replaced "customer loyalty marketing." " [Loyalty marketing. Wikipedia]
The arrow circle diagram example "Loyalty" was created using the ConceptDraw PRO diagramming and vector drawing software extended with the Target and Circular Diagrams solution from the Marketing area of ConceptDraw Solution Park.
www.conceptdraw.com/ solution-park/ marketing-target-and-circular-diagrams
Arrow circle diagram
 Enterprise Architecture Diagrams
Enterprise Architecture Diagrams solution extends ConceptDraw PRO software with templates, samples and library of vector stencils for drawing the diagrams of enterprise architecture models.
"Advanced Persistent Threat (APT) APT is a set of stealthy and continuous hacking processes often orchestrated by human targeting a specific entity. APT usually targets organizations and or nations for business or political motives. APT processes require high degree of covertness over a long period of time. As the name implies, APT consists of three major components/ processes: advanced, persistent, and threat. The advanced process signifies sophisticated techniques using malware to exploit vulnerabilities in systems. The persistent process suggests that an external command and control is continuously monitoring and extracting data off a specific target. The threat process indicates human involvement in orchestrating the attack.
APT usually refers to a group, such as a government, with both the capability and the intent to persistently and effectively target a specific entity. The term is commonly used to refer to cyber threats, in particular that of Internet-enabled espionage using a variety of intelligence gathering techniques to access sensitive information, but applies equally to other threats such as that of traditional espionage or attack. Other recognized attack vectors include infected media, supply chain compromise, and social engineering. Individuals, such as an individual hacker, are not usually referred to as an APT as they rarely have the resources to be both advanced and persistent even if they are intent on gaining access to, or attacking, a specific target." [Advanced persistent threat. Wikipedia]
This circular arrows diagram example was redesigned from the Wikimedia Commons file: Advanced persistent threat lifecycle.jpg.
[commons.wikimedia.org/ wiki/ File:Advanced_ persistent_ threat_ lifecycle.jpg]
This file is licensed under the Creative Commons Attribution-Share Alike 3.0 Unported license. [creativecommons.org/ licenses/ by-sa/ 3.0/ deed.en]
The example "Advanced persistent threat lifecycle" was created using the ConceptDraw PRO diagramming and vector drawing software extended with the Circular Arrows Diagrams solution from the area "What is a Diagram" of ConceptDraw Solution Park.
Circular arrows diagram

 Marketing Diagrams
This solution extends ConceptDraw PRO with samples, templates and library of design elements for drawing the marketing diagrams.
 Venn Diagrams
Venn Diagrams are actively used to illustrate simple set relationships in set theory and probability theory, logic and statistics, mathematics and computer science, linguistics, sociology, and marketing. Venn Diagrams are also often used to visually summarize the status and future viability of a project.
This circular motion diagram sample was created on the base of the figure illustrating the article "Collaboration 2.0" from the HLWIKI International website. "Collaboration is an activity where individuals are motivated to work together in order to achieve certain mutually-desirable, articulated and achievable goals. In the digital age, collaboration 2.0 combines various aspects of web 2.0 and social media with the principles of collaboration. Some critical or typical features of collaboration 2.0 should include:
(1) synchronous collaboration via social calendaring, online meeting software and instant messaging tools,
(2) asynchronous collaboration made possible via shared workspaces and annotation capabilities.
A new form of collaboration is called collaborative information seeking which Wikipedia defines as "... a field of research that involves studying situations, motivations, and methods for people working in collaborative groups for information seeking projects, as well as building systems for supporting such activities. Such projects often involve information searching or information retrieval (IR), information gathering, and information sharing. Beyond that, CIS can extend to collaborative information synthesis and collaborative sense-making." " [hlwiki.slais.ubc.ca/ index.php/ Collaboration_ 2.0]
This file is available under a Creative Commons Attribution-NonCommercial-ShareAlike 2.5 Generic Licence. [creativecommons.org/ licenses/ by-nc-sa/ 2.5/ ]
The circular arrow diagram example "Collaboration life-cycle" was created using the ConceptDraw PRO diagramming and vector drawing software extended with the Target and Circular Diagrams solution from the Marketing area of ConceptDraw Solution Park.
www.conceptdraw.com/ solution-park/ marketing-target-and-circular-diagrams
Circular motion diagram
- Circular arrows diagram
- Circular Arrows Diagrams | Target and Circular Diagrams | Circle ...
- Circular Arrows Diagrams | Best Software to Draw Diagrams ...
- Circular arrows diagrams
- Circular arrows diagram
- Circular Arrows Diagrams | Target and Circular Diagrams | Basic ...
- Arrow circle chart template | Circular Arrows Diagrams | Circular ...
- Circular arrows diagram - Quality cycle | Arrow circle chart template ...
- Arrow circle chart template | Basic Diagramming | Circular Arrows ...
- Circular Arrows Diagrams
- Arrow circle chart template | Circular arrows diagram - PDCA cycle ...
- Circular arrows diagram - Business process life cycle | Target and ...
- Circular diagrams - Vector stencils library | Arrow circle chart ...
- Circular Arrows Diagrams | Basic Diagramming | SWOT Analysis ...
- Circular arrows diagram - Quality cycle | Water cycle diagram ...
- Circular arrows diagram - Quality cycle | Design elements ...
- Basic Diagramming | Arrow circle chart template | Best Diagramming ...
- Circular Arrows Diagrams | Timeline Diagrams | Basic Diagramming ...
- Circular arrows diagram - Business process life cycle | Basic ...
- Circular arrows diagram - Quality cycle | Citric acid cycle (TCA cycle ...