The vector stencils library "Circular arrows diagrams" contains 20 templates of circular arrows diagrams and arrow donut charts.
Use these shapes to draw your circular arrows diagrams in the ConceptDraw PRO diagramming and vector drawing software.
The vector stencils library "Circular arrows diagrams" is included in the Circular Arrows Diagrams solution from the area "What is a Diagram" of ConceptDraw Solution Park.
Use these shapes to draw your circular arrows diagrams in the ConceptDraw PRO diagramming and vector drawing software.
The vector stencils library "Circular arrows diagrams" is included in the Circular Arrows Diagrams solution from the area "What is a Diagram" of ConceptDraw Solution Park.
Circular arrows diagram - 3 elements

Circular arrows diagram - 4 elements

Circular arrows diagram - 5 elements

Circular arrows diagram - 6 elements

Circular arrows diagram - 7 elements

Arrows donut chart - 3 slices

Arrows donut chart - 4 slices

Arrows donut chart - 5 slices

Arrows donut chart - 6 slices

Arrows donut chart - 7 slices

Ring chart - 3 elements

Ring chart - 4 elements

Ring chart - 5 elements

Ring chart - 6 elements

Ring chart - 7 elements

Arrow circle diagram - 3 elements
Arrow circle diagram - 4 elements
Arrow circle diagram - 5 elements
Arrow circle diagram - 6 elements
Arrow circle diagram - 7 elements
The vector stencils library "Circular diagrams" contains 42 templates of circular diagrams: circular arrow diagram, circular motion diagram, arrow ring chart, doughnut chart (donut chart), circle pie chart, diamond pie chart, circle diagram, pie chart, ring chart, loop diagram, block loop diagram, arrow loop circle, crystal diagram, triangular diagram, diamond diagram, pentagon diagram, hexagon diagram, heptagon diagram, cycle diagram (cycle chart), stacked Venn diagram (onion diagram), arrow circle diagram.
Use these shapes to illustrate your marketing and sales documents, presentations, webpages and infographics in the ConceptDraw PRO diagramming and vector drawing software extended with the Target and Circular Diagrams solution from the Marketing area of ConceptDraw Solution Park.
www.conceptdraw.com/ solution-park/ marketing-target-and-circular-diagrams
Circular arrow diagram 1
Circular arrow diagram 2
Arrow ring chart
Doughnut chart

Diamond pie chart

Pie chart

Circle diagram

Circle pie chart 2

Circle pie chart 1

Ring chart 1 - 3 elements

Ring chart 1 - 4 elements

Ring chart 1 - 5 elements

Ring chart 1 - 6 elements

Ring chart 1 - 7 elements

Ring chart 2 - 3 elements

Ring chart 2 - 4 elements

Ring chart 2 - 5 elements

Ring chart 2 - 6 elements

Ring chart 2 - 7 elements

Crystal diagram - 3 elements

Crystal diagram - 4 elements

Crystal diagram - 5 elements

Crystal diagram - 6 elements

Crystal diagram - 7 elements

Stacked Venn diagram - 4

Stacked Venn diagram - 5

Stacked Venn diagram - 6

Stacked Venn diagram - 7

Basic loop diagram

Block loop diagram

Arrow loop circle
Arrow loop - 3 circles
Arrow loop - 4 circles
Arrow loop - 5 circles
Arrow loop - 6 circles
Arrow loop - 7 circles
Arrow circle diagram - 3
Arrow circle diagram - 4
Stacked Venn diagram - 3

Arrow circle diagram - 5
Arrow circle diagram - 6
Arrow circle diagram - 7
The vector stencils library "Circular arrows diagrams" contains 20 templates of circular arrows diagrams and arrow donut charts.
Use these shapes to draw your circular arrows diagrams in the ConceptDraw PRO diagramming and vector drawing software.
The vector stencils library "Circular arrows diagrams" is included in the Circular Arrows Diagrams solution from the area "What is a Diagram" of ConceptDraw Solution Park.
Use these shapes to draw your circular arrows diagrams in the ConceptDraw PRO diagramming and vector drawing software.
The vector stencils library "Circular arrows diagrams" is included in the Circular Arrows Diagrams solution from the area "What is a Diagram" of ConceptDraw Solution Park.
Circular arrows diagram - 3 elements
Circular arrows diagram - 4 elements
Circular arrows diagram - 5 elements
Circular arrows diagram - 6 elements
Circular arrows diagram - 7 elements
Arrows donut chart - 3 slices
Arrows donut chart - 4 slices
Arrows donut chart - 5 slices
Arrows donut chart - 6 slices
Arrows donut chart - 7 slices
Ring chart - 3 elements
Ring chart - 4 elements
Ring chart - 5 elements
Ring chart - 6 elements
Ring chart - 7 elements
Arrow circle diagram - 3 elements
Arrow circle diagram - 4 elements
Arrow circle diagram - 5 elements
Arrow circle diagram - 6 elements
Arrow circle diagram - 7 elements
The vector stencils library "Circular diagrams" contains 42 templates of circular diagrams: circular arrow diagram, circular motion diagram, arrow ring chart, doughnut chart (donut chart), circle pie chart, diamond pie chart, circle diagram, pie chart, ring chart, loop diagram, block loop diagram, arrow loop circle, crystal diagram, triangular diagram, diamond diagram, pentagon diagram, hexagon diagram, heptagon diagram, cycle diagram (cycle chart), stacked Venn diagram (onion diagram), arrow circle diagram.
Use these shapes to illustrate your marketing and sales documents, presentations, webpages and infographics in the ConceptDraw PRO diagramming and vector drawing software extended with the Target and Circular Diagrams solution from the Marketing area of ConceptDraw Solution Park.
www.conceptdraw.com/ solution-park/ marketing-target-and-circular-diagrams
Use these shapes to illustrate your marketing and sales documents, presentations, webpages and infographics in the ConceptDraw PRO diagramming and vector drawing software extended with the Target and Circular Diagrams solution from the Marketing area of ConceptDraw Solution Park.
www.conceptdraw.com/ solution-park/ marketing-target-and-circular-diagrams
Circular arrow diagram 1
Circular arrow diagram 2
Arrow ring chart
Doughnut chart
Diamond pie chart
Pie chart
Circle diagram
Circle pie chart 2
Circle pie chart 1
Ring chart 1 - 3 elements
Ring chart 1 - 4 elements
Ring chart 1 - 5 elements
Ring chart 1 - 6 elements
Ring chart 1 - 7 elements
Ring chart 2 - 3 elements
Ring chart 2 - 4 elements
Ring chart 2 - 5 elements
Ring chart 2 - 6 elements
Ring chart 2 - 7 elements
Crystal diagram - 3 elements
Crystal diagram - 4 elements
Crystal diagram - 5 elements
Crystal diagram - 6 elements
Crystal diagram - 7 elements
Stacked Venn diagram - 4
Stacked Venn diagram - 5
Stacked Venn diagram - 6
Stacked Venn diagram - 7
Basic loop diagram
Block loop diagram
Arrow loop circle
Arrow loop - 3 circles
Arrow loop - 4 circles
Arrow loop - 5 circles
Arrow loop - 6 circles
Arrow loop - 7 circles
Arrow circle diagram - 3
Arrow circle diagram - 4
Stacked Venn diagram - 3
Arrow circle diagram - 5
Arrow circle diagram - 6
Arrow circle diagram - 7
Basic Flowchart Symbols and Meaning


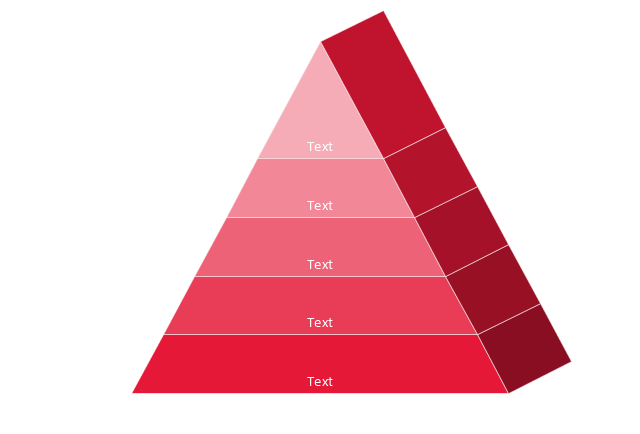
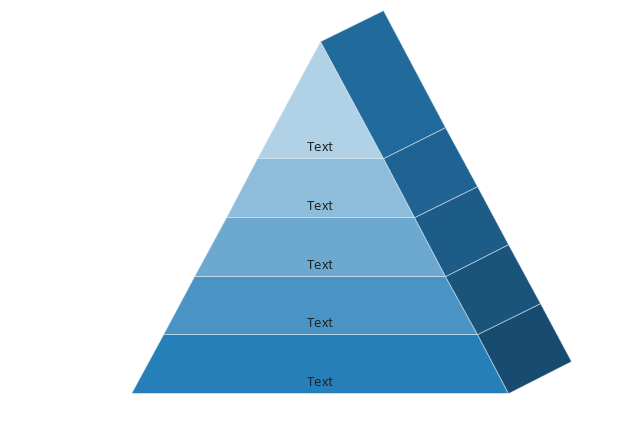
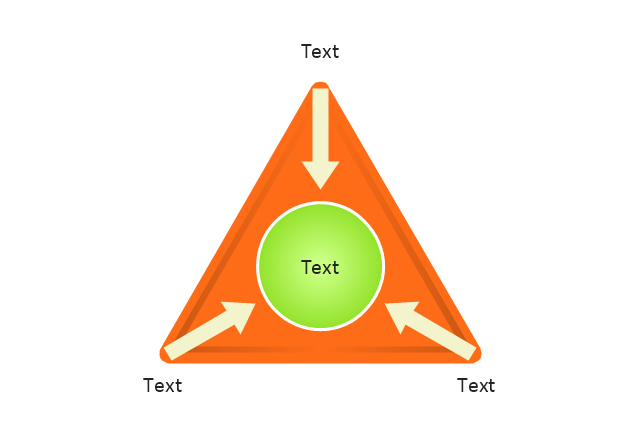
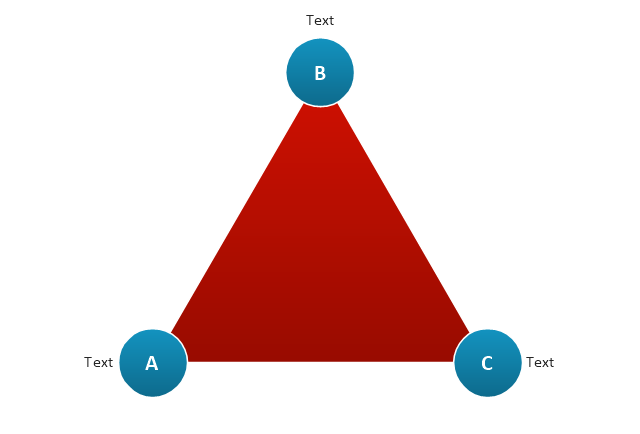
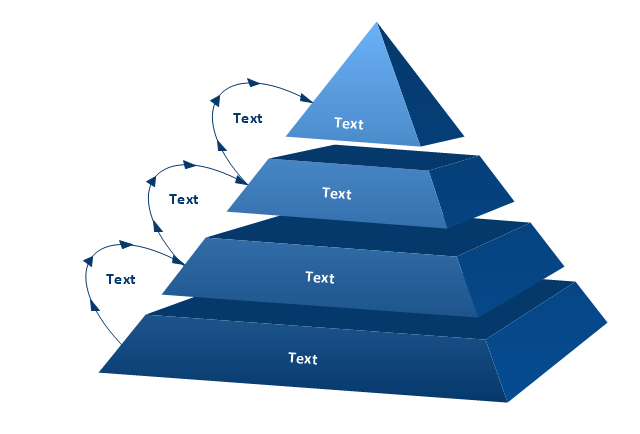
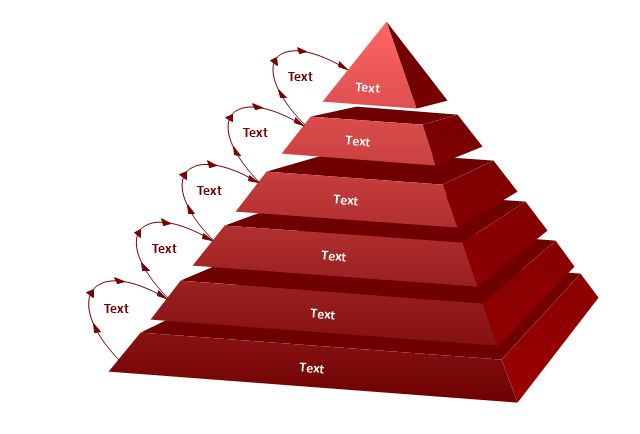
The vector stencils library "Pyramid diagrams" contains 28 templates of pyramid diagrams, triangle charts and triangular schemes.
Use these templates to create your pyramid diagrams in the ConceptDraw PRO diagramming and vector drawing software extended with the Pyramid Diagrams solution from the Marketing area of ConceptDraw Solution Park.
Use these templates to create your pyramid diagrams in the ConceptDraw PRO diagramming and vector drawing software extended with the Pyramid Diagrams solution from the Marketing area of ConceptDraw Solution Park.
Pyramid 1
Pyramid 2
Pyramid 3
Pyramid 4
Pyramid 5
Pyramid 1 Isometric
Pyramid 2 Isometric
Pyramid 3 Isometric
Pyramid 4 Isometric
Pyramid 5 Isometric
Triangle diagram, arrows
Triangle diagram
Triangular pyramid
Triangular diagram
Triangle scheme
Triangle chart

Triangle chart, isometric
Triangular scheme
Arrowed block pyramid
Funnel diagram
3-level funnel diagram
4-level funnel diagram
5-level funnel diagram
2-level pyramid diagram
3-level pyramid diagram
4-level pyramid diagram
5-level pyramid diagram
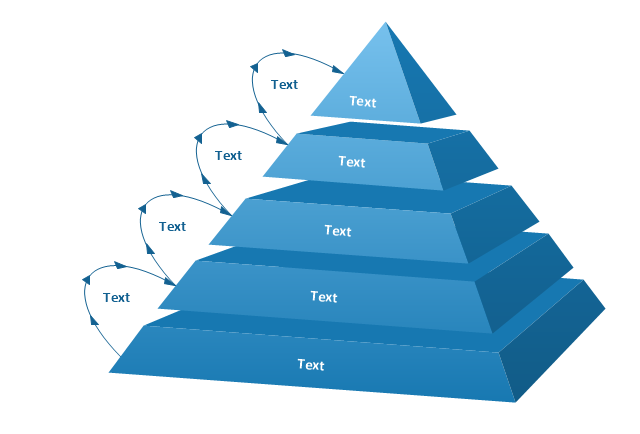
6-level pyramid diagram
Flowchart design. Flowchart symbols, shapes, stencils and icons


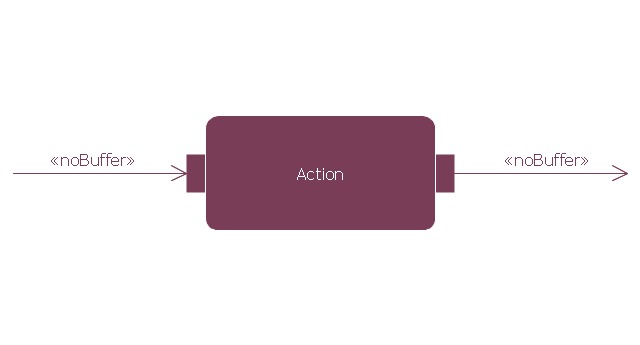
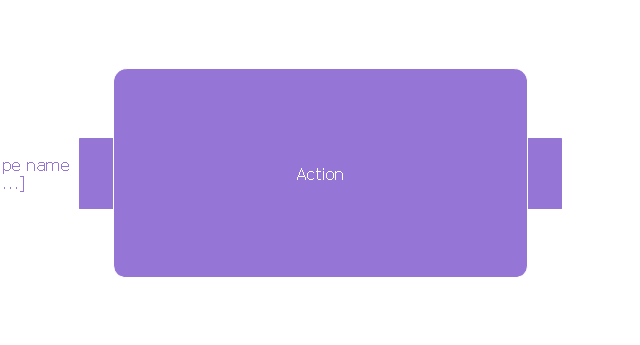
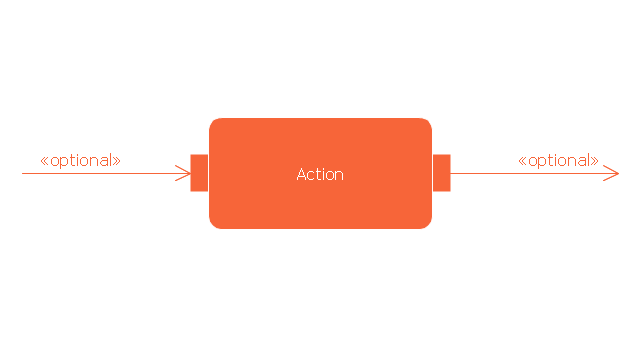
This vector stencils library contains 47 SysML activity diagram symbols.
Use it to design your SysML activity diagrams using ConceptDraw PRO diagramming and vector drawing software.
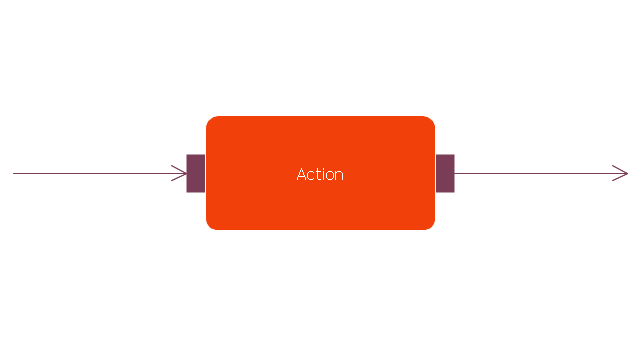
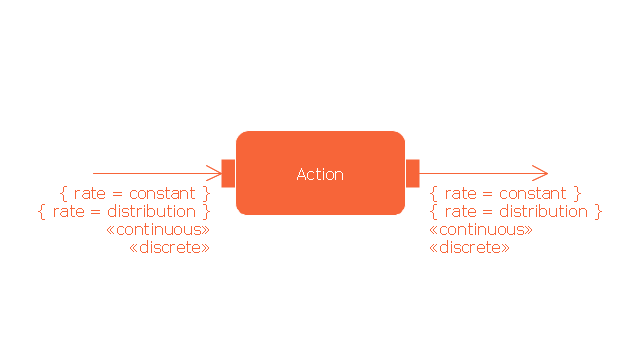
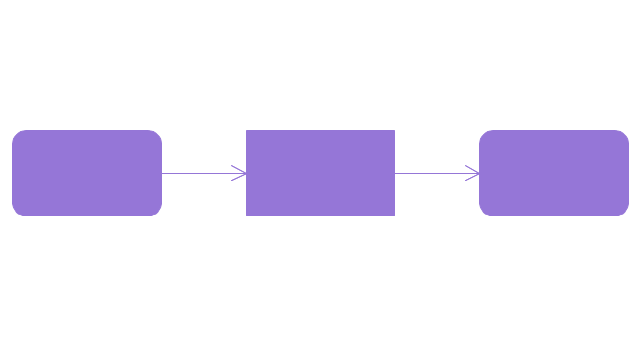
"Activity diagrams are constructed from a limited number of shapes, connected with arrows. The most important shape types:
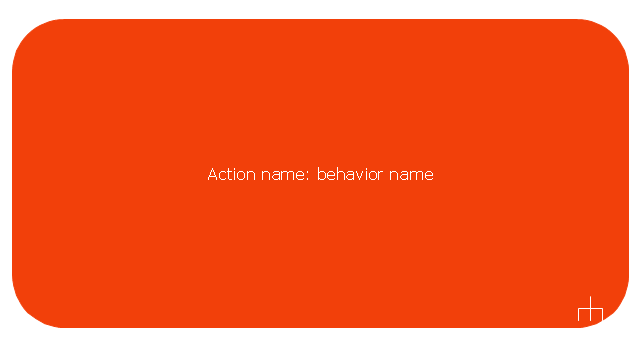
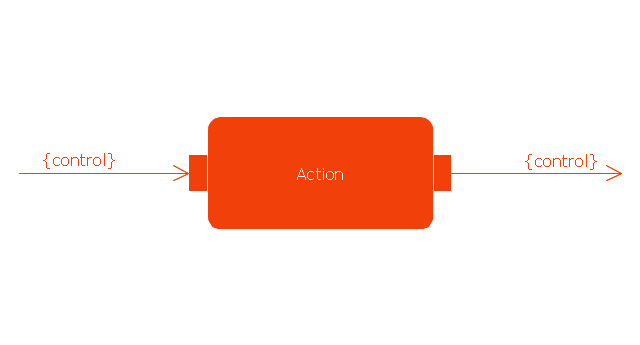
- rounded rectangles represent actions;
- diamonds represent decisions;
- bars represent the start (split) or end (join) of concurrent activities;
- a black circle represents the start (initial state) of the workflow;
- an encircled black circle represents the end (final state).
Arrows run from the start towards the end and represent the order in which activities happen." [Activity diagram. Wikipedia]
The vector stencils library "Activity diagram" is included in the SysML solution from the Software Development area of ConceptDraw Solution Park.
Use it to design your SysML activity diagrams using ConceptDraw PRO diagramming and vector drawing software.
"Activity diagrams are constructed from a limited number of shapes, connected with arrows. The most important shape types:
- rounded rectangles represent actions;
- diamonds represent decisions;
- bars represent the start (split) or end (join) of concurrent activities;
- a black circle represents the start (initial state) of the workflow;
- an encircled black circle represents the end (final state).
Arrows run from the start towards the end and represent the order in which activities happen." [Activity diagram. Wikipedia]
The vector stencils library "Activity diagram" is included in the SysML solution from the Software Development area of ConceptDraw Solution Park.
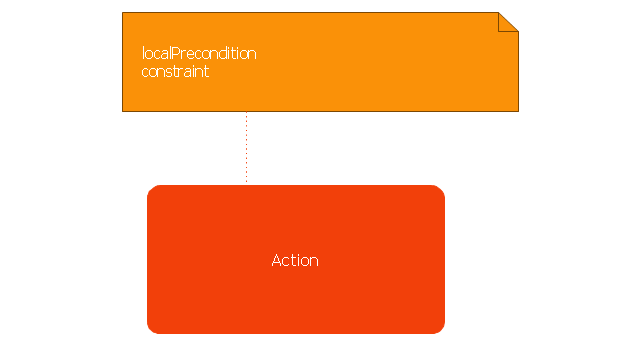
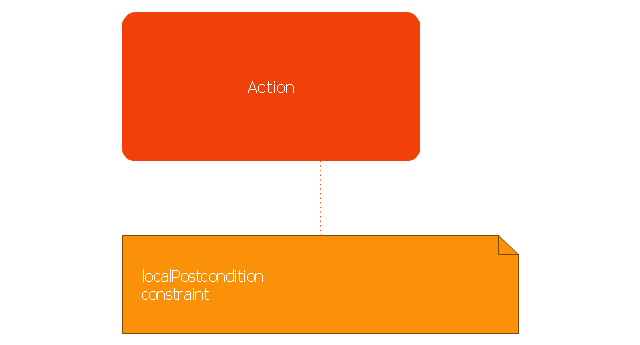
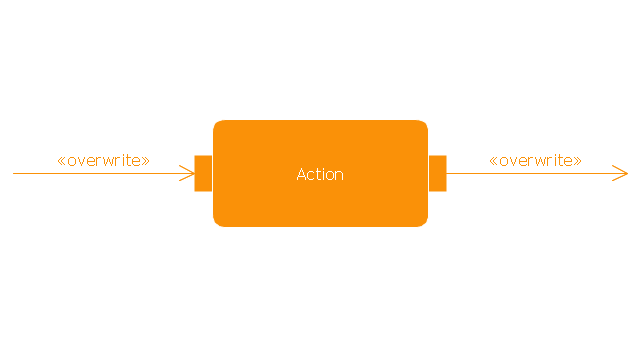
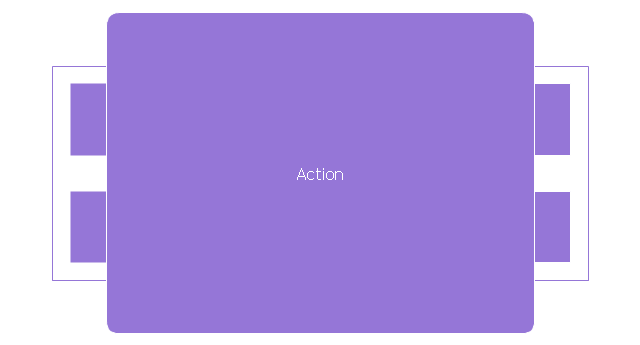
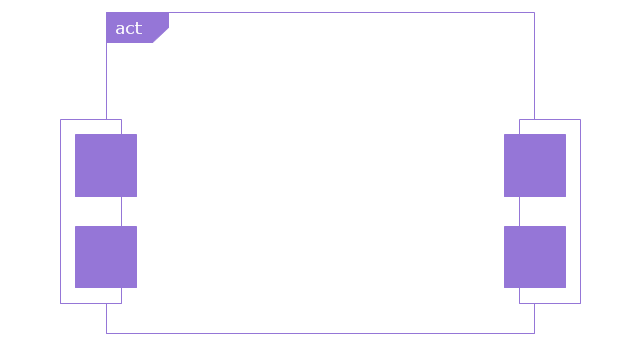
Action
Call behavior action
Accept event action

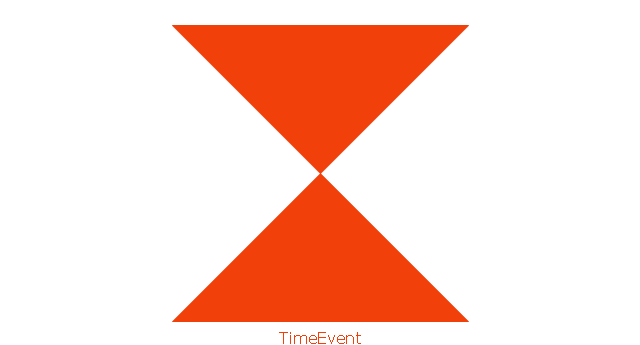
Accept time event action
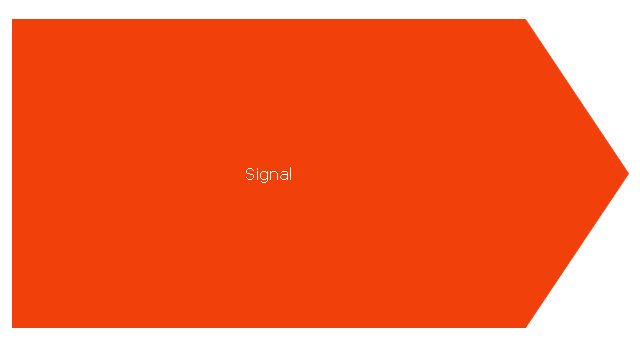
Send signal action
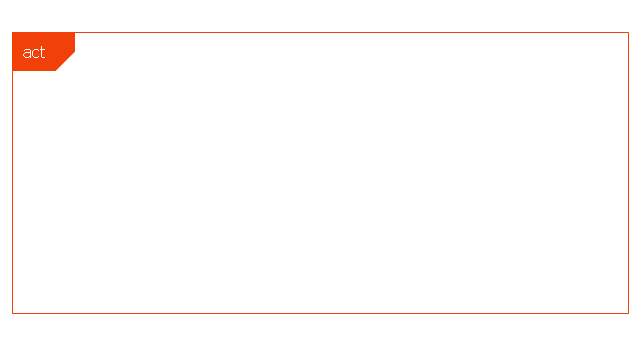
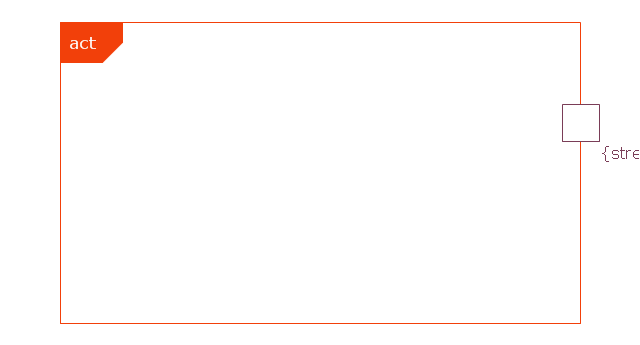
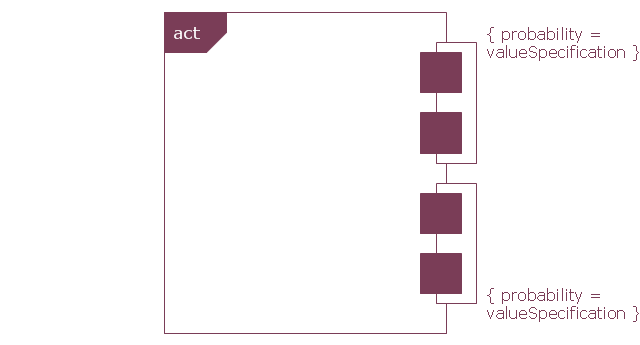
Activity
Activity final node
Flow final node
Activity parameter node
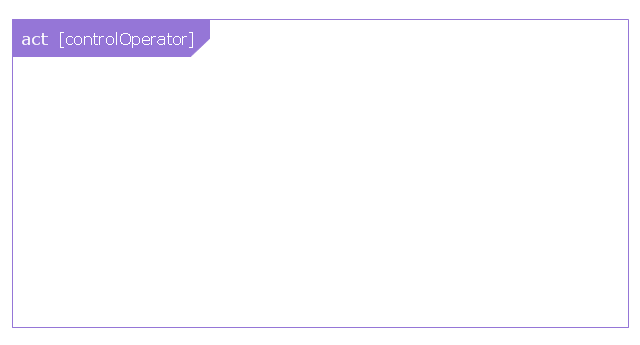
Control operator node
Control operator - frame
Decision/Merge node

Fork/Join node

Initial node
isControl
isStream
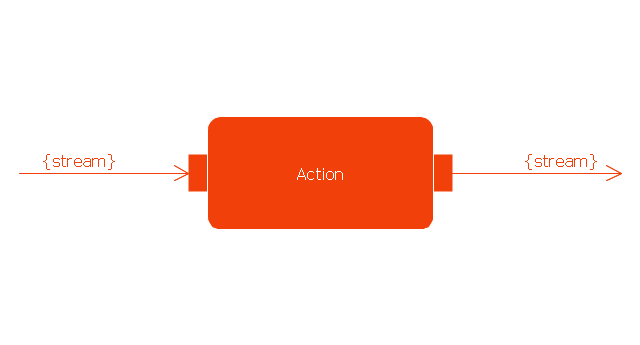
isStream 2
isStream 3
Local precondition
Local postcondition
NoBuffer
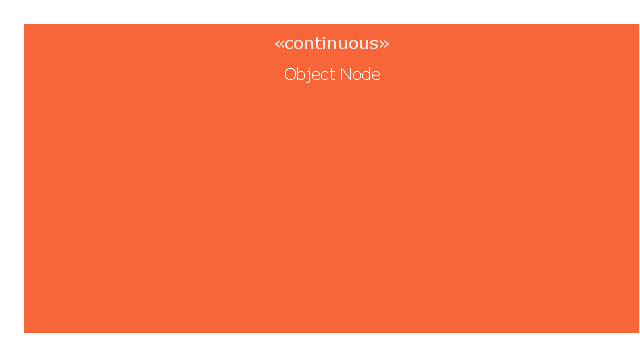
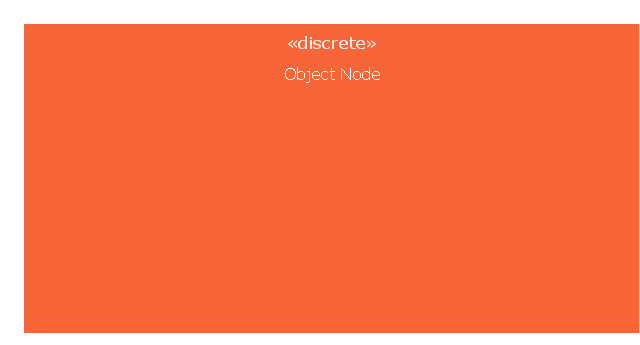
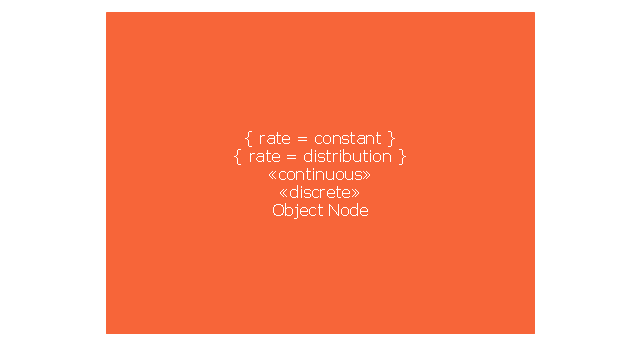
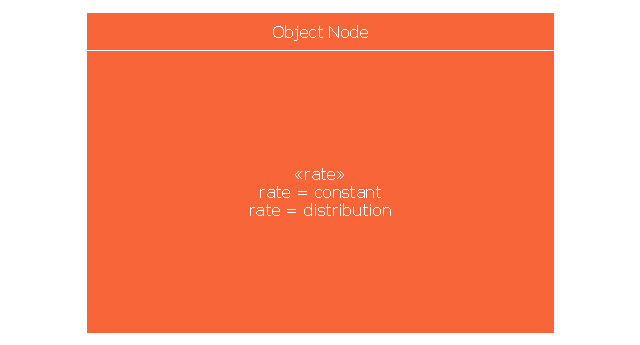
Object node
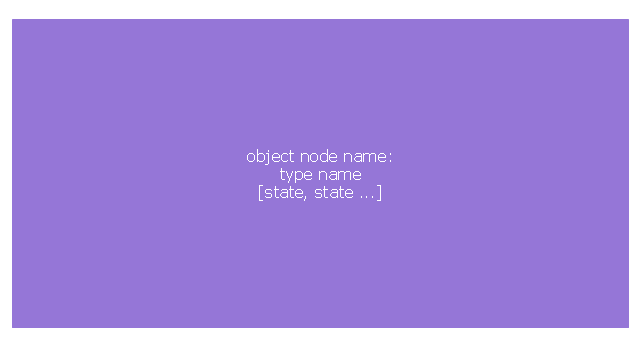
Object node 2
Optional
Optional 2
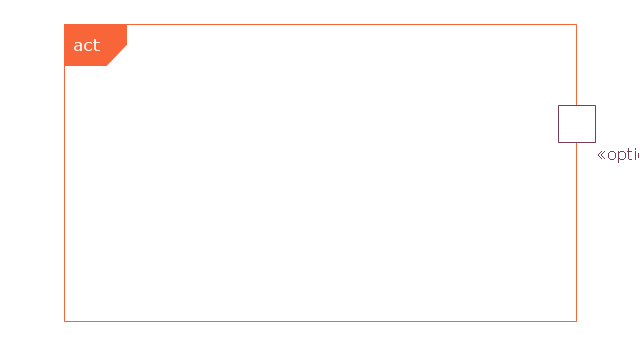
OverWrite
Parameter set
Parameter set 2
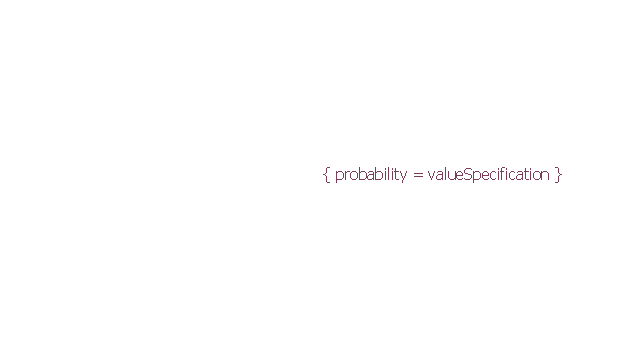
Probability
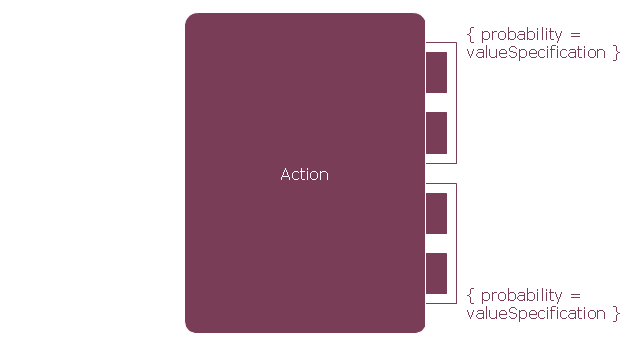
Probability 2
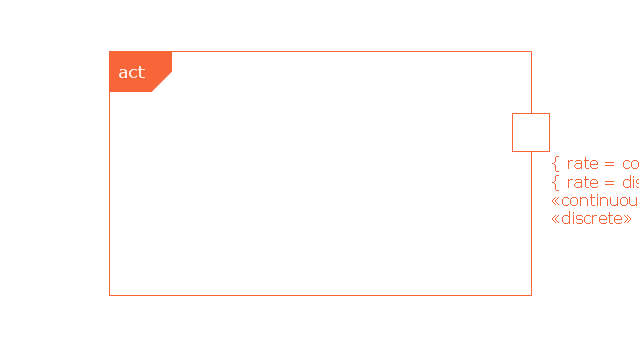
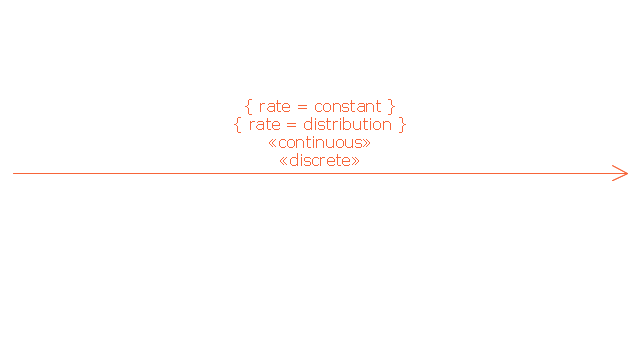
Rate
Rate 2
Rate 3
Rate 4
Rate 5
Rate 6
Control flow
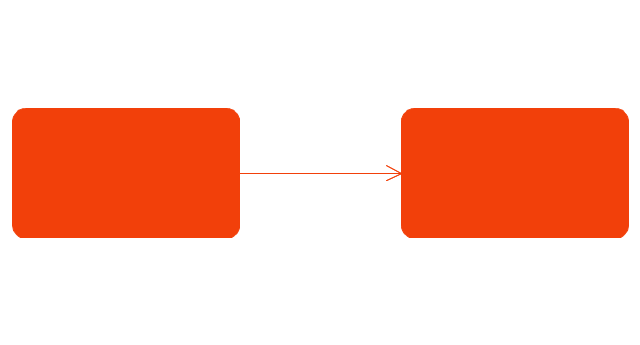
Control flow 2
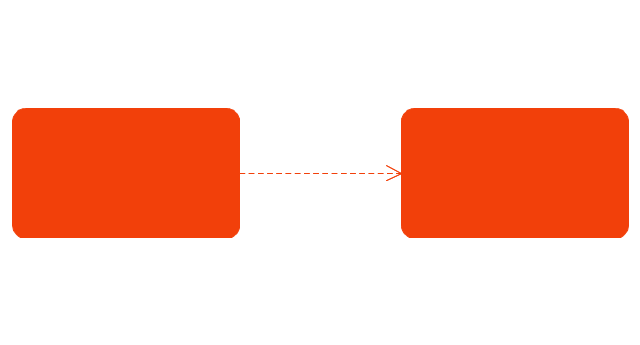
Object flow
Object flow 2

Probability path
Rate path
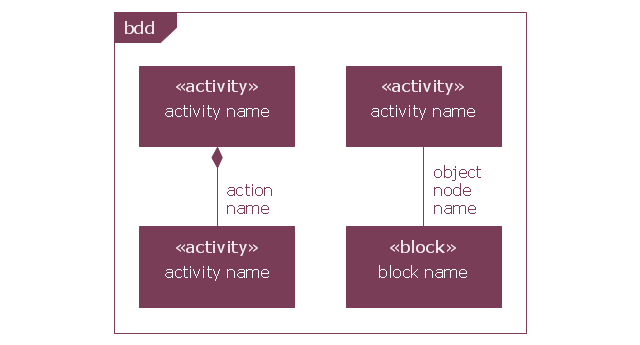
In block definition diagram, activity, association
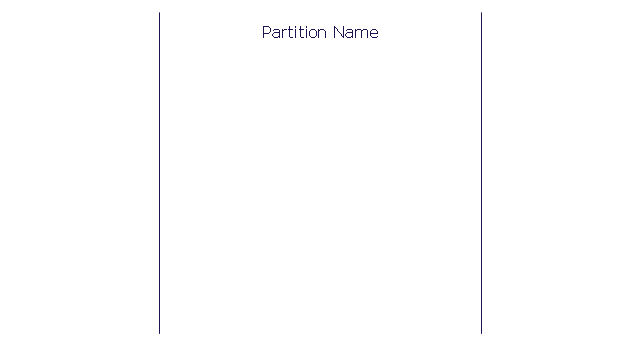
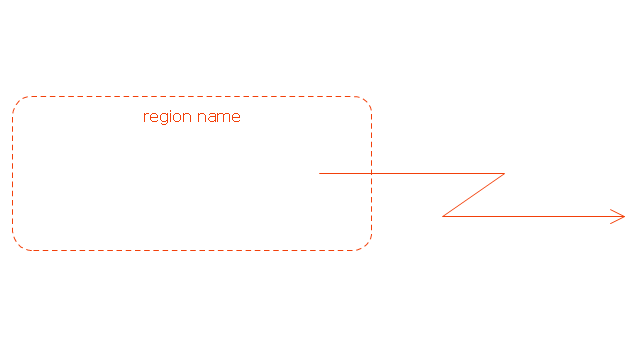
Activity partition
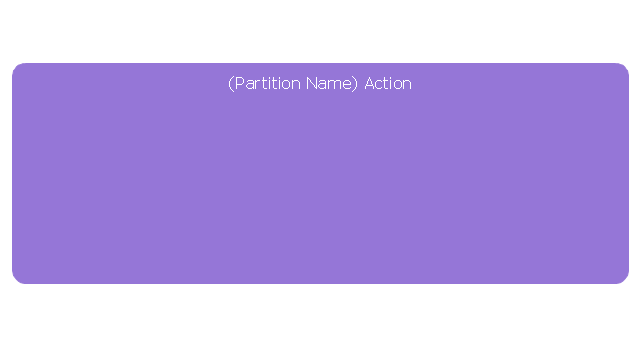
Activity partition - action
Interruptible activity region
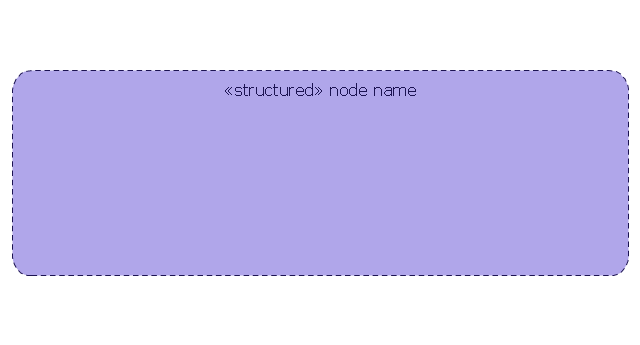
Structured activity node
Sales Steps

Flowcharting Software

Types of Flowcharts


 Business Package for Management
Package intended for professional who designing and documenting business processes, preparing business reports, plan projects and manage projects, manage organizational changes, prepare operational instructions, supervising specific department of an organization, workout customer service processes and prepare trainings for customer service personal, carry out a variety of duties to organize business workflow.
The vector stencils library "Composition charts" contains 6 templates: 2 pie charts, 2 divided bar charts and 2 double divided bar charts.
The vector stencils library "Composition indicators" contains 6 templates of visual indicators.
Use these design elements to visualize composition comparison of your data in your visual dashboard created using the ConceptDraw PRO diagramming and vector drawing software.
"A pie chart (or a circle graph) is a circular chart divided into sectors, illustrating numerical proportion. In a pie chart, the arc length of each sector (and consequently its central angle and area), is proportional to the quantity it represents. While it is named for its resemblance to a pie which has been sliced, there are variations on the way it can be presented. ...
An obvious flaw exhibited by pie charts is that they cannot show more than a few values without separating the visual encoding (the “slices”) from the data they represent (typically percentages). When slices become too small, pie charts have to rely on colors, textures or arrows so the reader can understand them. This makes them unsuitable for use with larger amounts of data. Pie charts also take up a larger amount of space on the page compared to the more flexible alternative of bar charts, which do not need to have separate legends, and can also display other values such as averages or targets at the same time. ...
Most subjects have difficulty ordering the slices in the pie chart by size; when the bar chart is used the comparison is much easier. Similarly, comparisons between data sets are easier using the bar chart. However, if the goal is to compare a given category (a slice of the pie) with the total (the whole pie) in a single chart and the multiple is close to 25 or 50 percent, then a pie chart can often be more effective than a bar graph." [Pie chart. Wikipedia]
The example "Design elements - Composition charts and indicators" is included in the Composition Dashboard solution from the area "What is a Dashboard" of ConceptDraw Solution Park.
Composition charts and visual indicators

 Cafe and Restaurant Floor Plans
Restaurants and cafes are popular places for recreation, relaxation, and are the scene for many impressions and memories, so their construction and design requires special attention. Restaurants must to be projected and constructed to be comfortable and e
How To Create a Workflow Diagram

- How to Draw a Circular Arrows Diagram Using ConceptDraw PRO ...
- Circle Arrow Diagram
- Arrow circle chart - Template | How to Draw a Circular Arrows ...
- How to Draw a Circular Arrows Diagram Using ConceptDraw PRO ...
- Arrow circle chart
- Target and Circular Diagrams | How to Draw a Circular Arrows ...
- Circular diagrams - Vector stencils library | Circular arrows diagrams ...
- Arrow circle chart - Template | DFD Library - Design elements ...
- Arrow circle chart - Template | Basic Flowchart Symbols and ...
- Circular Flow Diagram Template | Circular Arrow | Circular diagrams ...
- Arrow circle chart - Template | How to Draw the Different Types of ...
- Arrow circle diagram - 6 elements
- Arrow circle chart - Template | Circular diagrams - Vector stencils ...
- Arrow circle chart - Template | Circular Flow Diagram Template ...
- Circular Flow Diagram Template | Arrow circle chart - Template ...
- Target and Circular Diagrams | How to Draw a Circular Arrows ...
- Circular diagrams - Vector stencils library | Circular Arrows ...
- Circular Arrows | Circular Flow Diagram Template | Circular Arrows ...
- Target and Circular Diagrams | Circular Arrows Diagrams | Circular ...
- Vector Arrow Circle