Pie Chart Examples and Templates

Pie chart examples and templates created using ConceptDraw PRO software helps you get closer with pie charts and find pie chart examples suite your needs.
 Circle-Spoke Diagrams
Examples of subject areas that are well suited to this approach are marketing, business, products promotion, process modeling, market, resource, time, and cost analysis. Circle-Spoke Diagrams are successfully used in presentations, conferences, management documents, magazines, reportages, reviews, reports, TV, and social media.
 ConceptDraw Solution Park
ConceptDraw Solution Park collects graphic extensions, examples and learning materials
Donut Chart

 Line Graphs
How to draw a Line Graph with ease? The Line Graphs solution extends the capabilities of ConceptDraw PRO v10 with professionally designed templates, samples, and a library of vector stencils for drawing perfect Line Graphs.
 Bar Graphs
The Bar Graphs solution enhances ConceptDraw PRO v10 functionality with templates, numerous professional-looking samples, and a library of vector stencils for drawing different types of Bar Graphs, such as Simple Bar Graph, Double Bar Graph, Divided Bar Graph, Horizontal Bar Graph, Vertical Bar Graph, and Column Bar Chart.
 Picture Graphs
Typically, a Picture Graph has very broad usage. They many times used successfully in marketing, management, and manufacturing. The Picture Graphs Solution extends the capabilities of ConceptDraw PRO v10 with templates, samples, and a library of professionally developed vector stencils for designing Picture Graphs.
The vector stencils library "Composition charts" contains 6 templates: 2 pie charts, 2 divided bar charts and 2 double divided bar charts.
The vector stencils library "Composition indicators" contains 6 templates of visual indicators.
Use these design elements to visualize composition comparison of your data in your visual dashboard created using the ConceptDraw PRO diagramming and vector drawing software.
"A pie chart (or a circle graph) is a circular chart divided into sectors, illustrating numerical proportion. In a pie chart, the arc length of each sector (and consequently its central angle and area), is proportional to the quantity it represents. While it is named for its resemblance to a pie which has been sliced, there are variations on the way it can be presented. ...
An obvious flaw exhibited by pie charts is that they cannot show more than a few values without separating the visual encoding (the “slices”) from the data they represent (typically percentages). When slices become too small, pie charts have to rely on colors, textures or arrows so the reader can understand them. This makes them unsuitable for use with larger amounts of data. Pie charts also take up a larger amount of space on the page compared to the more flexible alternative of bar charts, which do not need to have separate legends, and can also display other values such as averages or targets at the same time. ...
Most subjects have difficulty ordering the slices in the pie chart by size; when the bar chart is used the comparison is much easier. Similarly, comparisons between data sets are easier using the bar chart. However, if the goal is to compare a given category (a slice of the pie) with the total (the whole pie) in a single chart and the multiple is close to 25 or 50 percent, then a pie chart can often be more effective than a bar graph." [Pie chart. Wikipedia]
The example "Design elements - Composition charts and indicators" is included in the Composition Dashboard solution from the area "What is a Dashboard" of ConceptDraw Solution Park.
Composition charts and visual indicators

Best Diagramming


 Value Stream Mapping
Value stream mapping solution extends ConceptDraw PRO software with templates, samples and vector stencils for drawing the Value Stream Maps (VSM) in lean manufacturing practice.
 Pie Charts
Pie Charts are extensively used in statistics and business for explaining data and work results, in mass media for comparison (i.e. to visualize the percentage for the parts of one total), and in many other fields. The Pie Charts solution for ConceptDraw PRO v10 offers powerful drawing tools, varied templates, samples, and a library of vector stencils for simple construction and design of Pie Charts, Donut Chart, and Pie Graph Worksheets.
Pie Chart Word Template. Pie Chart Examples

 Circular Arrows Diagrams
Circular Arrows Diagrams solution extends ConceptDraw PRO v10 with extensive drawing tools, predesigned samples, Circular flow diagram template for quick start, and a library of ready circular arrow vector stencils for drawing Circular Arrow Diagrams, Segmented Cycle Diagrams, and Circular Flow Diagrams. The elements in this solution help managers, analysts, business advisers, marketing experts, scientists, lecturers, and other knowledge workers in their daily work.
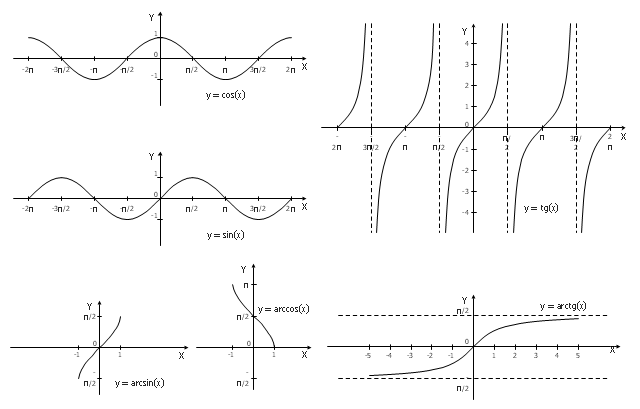
The vector stencils library "Trigonometric functions" contains 8 shapes of trigonometrical and inverse trigonometrical functions graphs.
"In mathematics, the trigonometric functions (also called the circular functions) are functions of an angle. They relate the angles of a triangle to the lengths of its sides. Trigonometric functions are important in the study of triangles and modeling periodic phenomena, among many other applications.
The most familiar trigonometric functions are the sine, cosine, and tangent. In the context of the standard unit circle with radius 1 unit, where a triangle is formed by a ray originating at the origin and making some angle with the x-axis, the sine of the angle gives the length of the y-component (the opposite to the angle or the rise) of the triangle, the cosine gives the length of the x-component (the adjacent of the angle or the run), and the tangent function gives the slope (y-component divided by the x-component). More precise definitions are detailed below. Trigonometric functions are commonly defined as ratios of two sides of a right triangle containing the angle, and can equivalently be defined as the lengths of various line segments from a unit circle. More modern definitions express them as infinite series or as solutions of certain differential equations, allowing their extension to arbitrary positive and negative values and even to complex numbers." [Trigonometric functions. Wikipedia]
The shapes example "Design elements - Trigonometric functions" was created using the ConceptDraw PRO diagramming and vector drawing software extended with the Mathematics solution from the Science and Education area of ConceptDraw Solution Park.
Trigonometrical and inverse trigonometrical functions - Graphs
 Rapid UML
Rapid UML solution extends ConceptDraw PRO software with templates, samples and libraries of vector stencils for quick drawing the UML diagrams using Rapid Draw technology.
 Target and Circular Diagrams
This solution extends ConceptDraw PRO software with samples, templates and library of design elements for drawing the Target and Circular Diagrams.
 Venn Diagrams
Venn Diagrams are actively used to illustrate simple set relationships in set theory and probability theory, logic and statistics, mathematics and computer science, linguistics, sociology, and marketing. Venn Diagrams are also often used to visually summarize the status and future viability of a project.
 HVAC Plans
Use HVAC Plans solution to create professional, clear and vivid HVAC-systems design plans, which represent effectively your HVAC marketing plan ideas, develop plans for modern ventilation units, central air heaters, to display the refrigeration systems for automated buildings control, environmental control, and energy systems.
 Wireless Networks
The Wireless Networks Solution extends ConceptDraw PRO v10 software with professional diagramming tools to help network engineers and designers efficiently design and create wireless network diagrams that illustrate wireless networks of any speed and complexity.
- Pie Chart Examples and Templates | Pie Graph Worksheets | How to ...
- Graphs and Charts Area | Pie Charts | Chart Maker for Presentations ...
- Arrow circle chart template | Basic Diagramming | Best Diagramming ...
- Arrow pie chart template
- Schedule pie chart - Daily action plan | Circle Graph Sample Stident ...
- Pie Chart Examples and Templates | Pie Chart Software | How to ...
- Chart Examples | Design elements - Pie charts | Donut chart ...
- Arrow graph - Total value of manufacturers' shipments | Arrow pie ...
- Arrow circle chart template | Design elements - Pie charts | Pie Chart ...
- Basic Diagramming | Arrow pie chart template | Pie Chart Examples ...
- Arrow pie chart template | Pie Chart Examples and Templates ...
- Pie chart template | Pie chart - Domestic energy consumption | Pie ...
- Arrow circle chart template | Arrow pie chart template | Basic ...
- Pie Chart Software | Pie Chart Examples and Templates | Pie Chart ...
- Target and Circular Diagrams | Brand essence model - Wheel ...
- Pie Chart Word Template
- Donut Chart Templates | Pie Donut Chart. Pie Chart Examples | Pie ...
- Bar Graph | Bar Chart Software | Bar Graphs | Example Of Design Of ...
- Pie Donut Chart. Pie Chart Examples
- Arrow circle chart template | Arrow pie chart template | Circular ...