 HR Dashboard
The HR Dashboard solution extends ConceptDraw DIAGRAM functionality with powerful drawing tools and great collection of comprehensive vector design elements, icons, pictograms and objects, navigation elements, live objects of HR charts, HR indicators, and thematic maps. The range of HR Dashboards applications is extensive, among them the human resource management, recruitment, hiring process, human resource development. ConceptDraw DIAGRAM software is perfect for creation HR Dashboard with any goal you need. It gives you all opportunities for designing not only informative, but also professional looking and attractive HR Dashboards of any style and degree of detalization, that are perfect for using in presentations, reports and other thematic documents.
 Status Dashboard
Status dashboard solution extends ConceptDraw DIAGRAM software with templates, samples and vector stencils libraries with graphic indicators for drawing the visual dashboards showing status data.
 Timeline Diagrams
Timeline Diagrams solution extends ConceptDraw DIAGRAM diagramming software with samples, templates and libraries of specially developed smart vector design elements of timeline bars, time intervals, milestones, events, today marker, legend, and many other elements with custom properties, helpful for professional drawing clear and intuitive Timeline Diagrams. Use it to design simple Timeline Diagrams and designate only the main project stages, or highly detailed Timeline Diagrams depicting all project tasks, subtasks, milestones, deadlines, responsible persons and other description information, ideal for applying in presentations, reports, education materials, and other documentation.
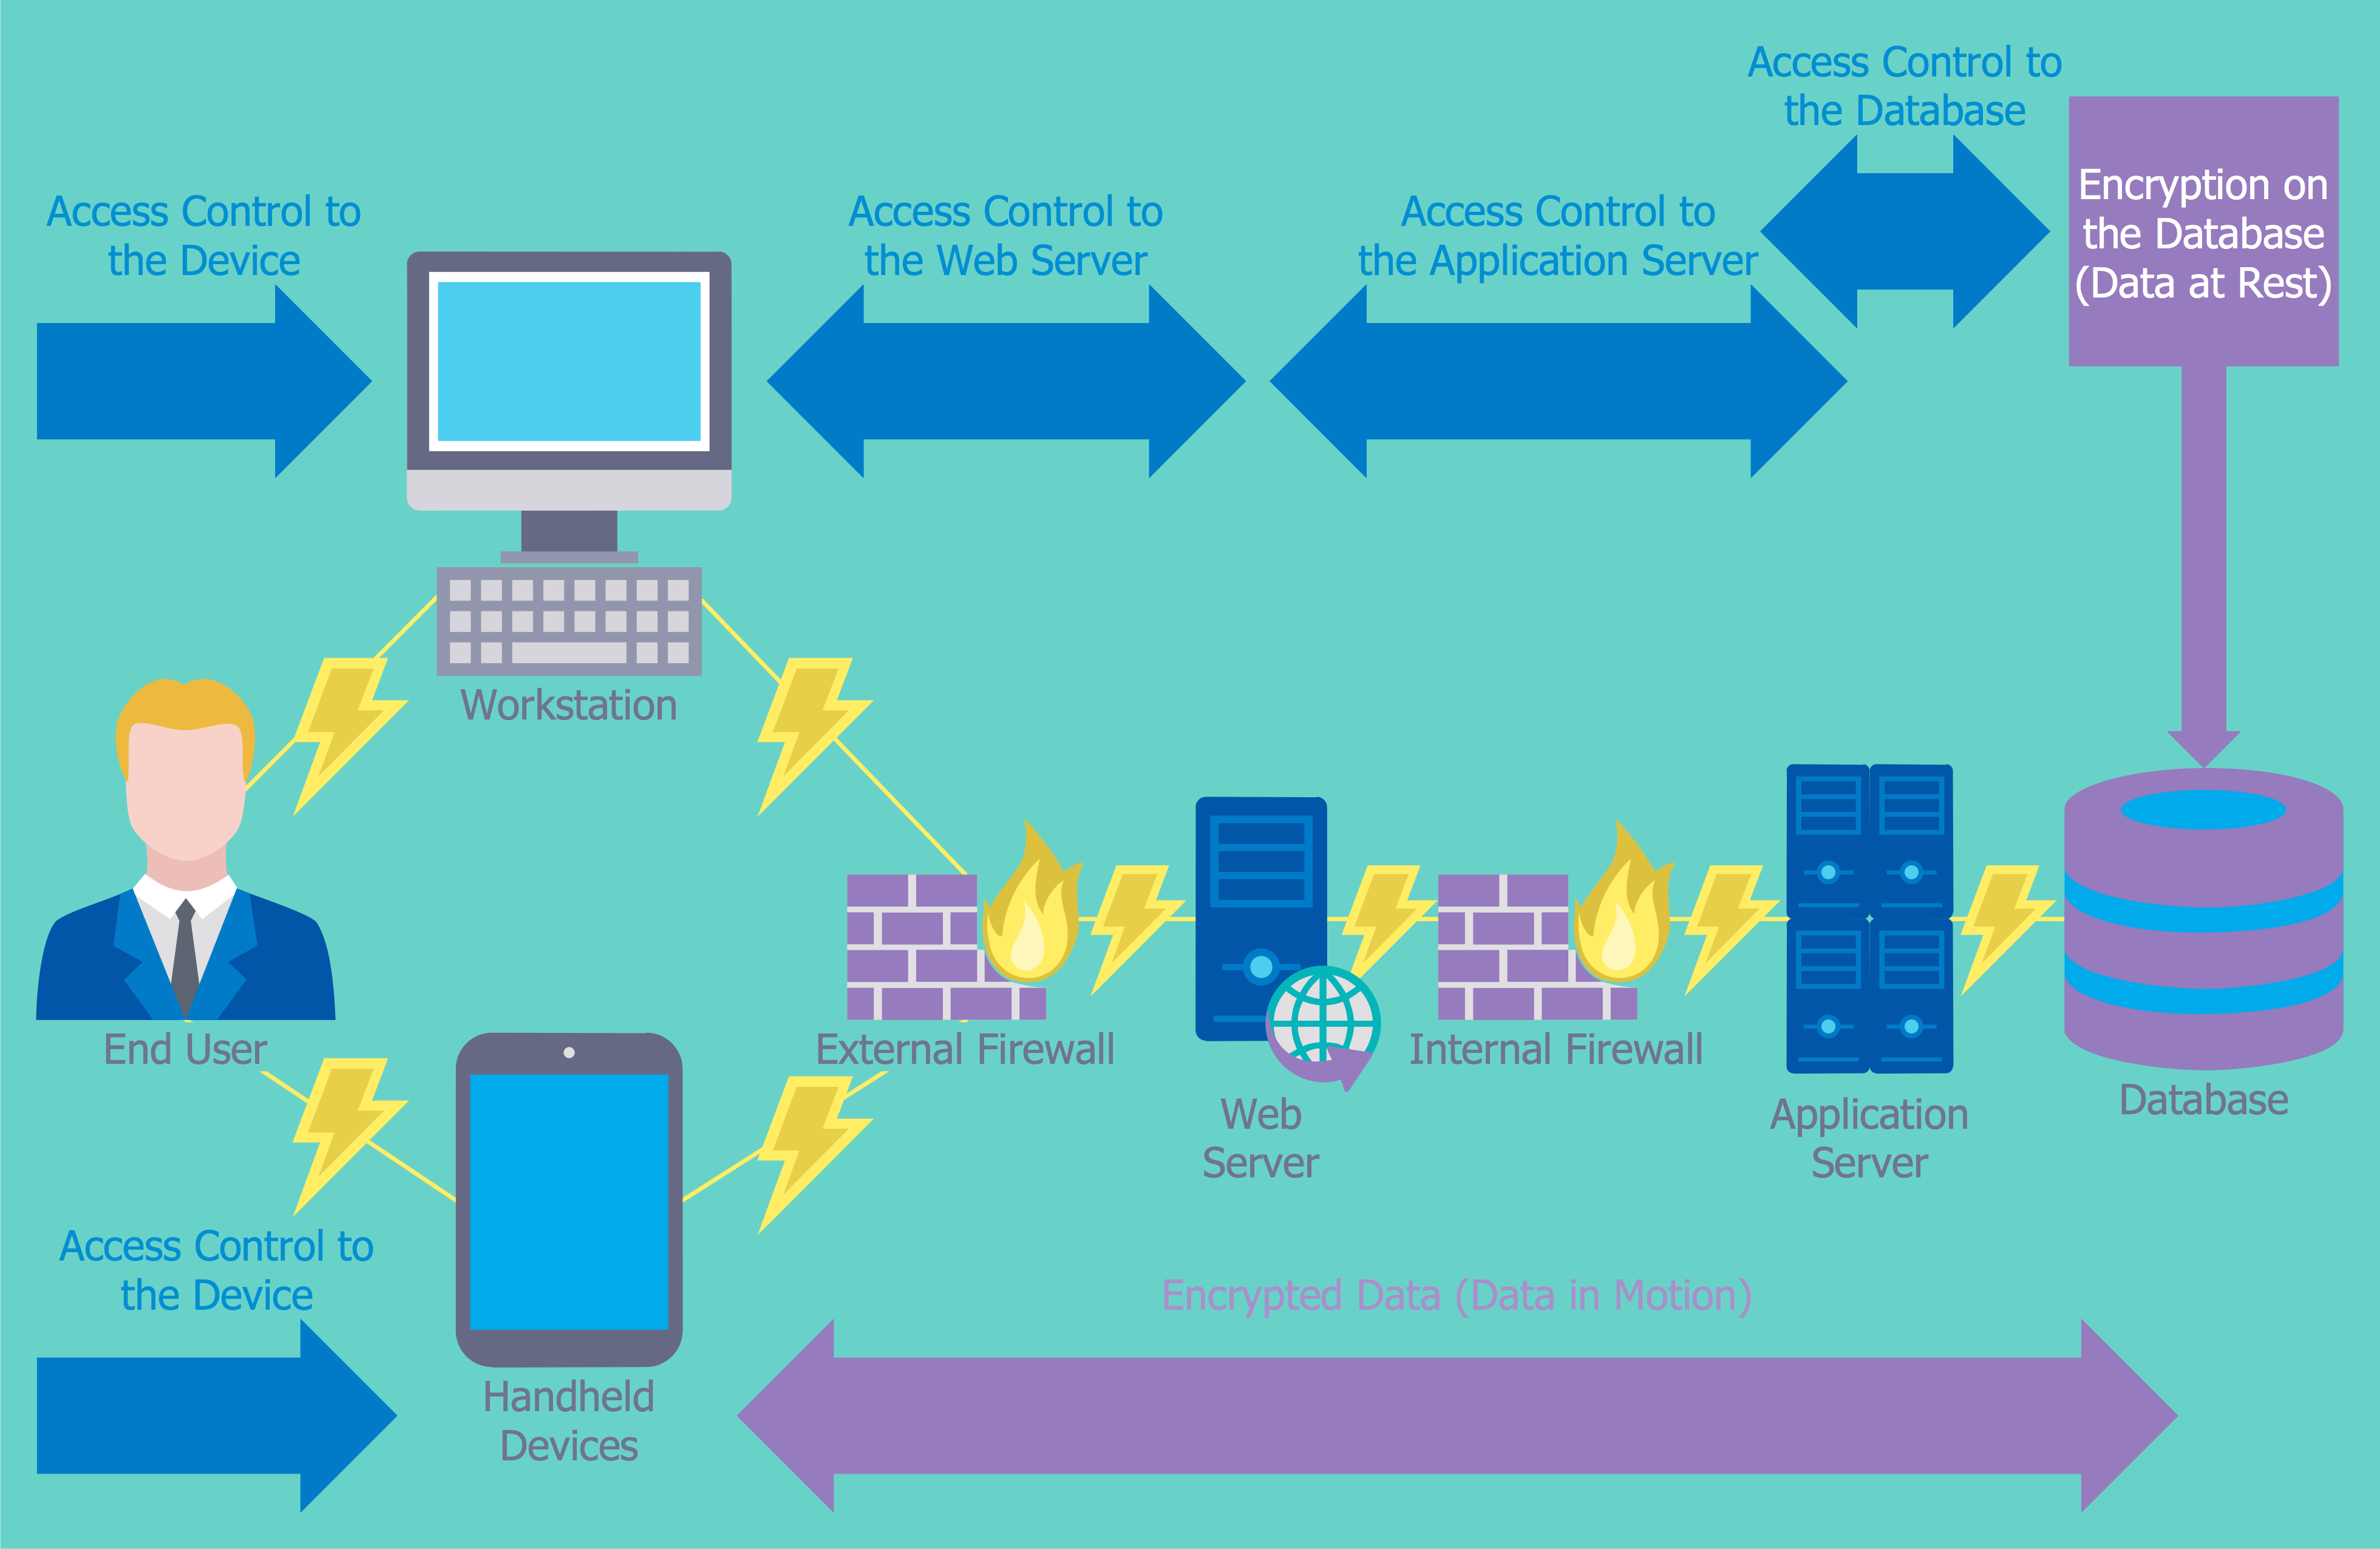
Network Security Devices
 Resource Usage Reports
The Resource Usage Reports solution supplies the ConceptDraw PROJECT software with a large set of useful project examples and extensive reporting abilities in resources planning, their allocation and use. The reports offered by this solution allow all project management specialists to study in detail the use of company's resources in a specific project, to evaluate their efficiency, productivity, sufficiency of their use, to detect in time the problems in resources allocation within a project or a group of projects, and to eliminate detected irrationalities in resource usage and loss of working time. Choosing the report type that suits your management needs better, you can receive the information for different time periods (week, month, etc.) about resources involved in a project, their usage and tasks on which they are assigned, about workloads of employees in tasks in hours or in per cent during a fixed period of time, project’s overloaded or underloaded work resources and overallocation periods, about material resources assignments for projects and their utilization by tasks, and other information.
 Business Diagrams
The Business Diagrams Solution extends ConceptDraw DIAGRAM with an extensive collection of professionally designed illustrative samples and a wide variety of vector stencils libraries, which are the real help for all business-related people, business analysts, business managers, business advisers, marketing experts, PR managers, knowledge workers, scientists, and other stakeholders allowing them to design the bright, neat, expressive and attractive Bubble Diagrams, Circle-Spoke Diagrams, Circular Arrows Diagrams, and Venn Diagrams with different quantity of sets in just minutes; and then successfully use them in documents, reports, statistical summaries, and presentations of any style.
 Business Process Workflow Diagrams
The Business Process Workflow Diagrams solution enhances the ConceptDraw DIAGRAM functionality with predesigned examples, samples and a numerous collection of predesigned vector objects of workflow chart elements, icons, arrows, connectors, and varied wor
 MINDMAP Reports
The MINDMAP Reports solution extends the boundaries of interrelations between the ConceptDraw MINDMAP and ConceptDraw PROJECT applications. After planning your projects in a project management software, you can then implement them and display the reports in a graphical format of visual Mind Maps. Intended for all project managers, team leaders, management assistants, and other project participants, this solution offers the set of project examples and a wide choice of report kinds, which you can generate in a moment in a form of Mind Map document to track visually your project results and progress, to analyze the work of project team and individual employees, to control the tasks' execution, including the top level and critical tasks, the project milestones and many other key project parameters.
, t chart, decision matrix, decision tree analysis") Decision Making
Decision Making
The Decision Making solution offers the set of professionally developed examples, powerful drawing tools and a wide range of libraries with specific ready-made vector decision icons, decision pictograms, decision flowchart elements, decision tree icons, decision signs arrows, and callouts, allowing the decision maker (even without drawing and design skills) to easily construct Decision diagrams, Business decision maps, Decision flowcharts, Decision trees, Decision matrix, T Chart, Influence diagrams, which are powerful in questions of decision making, holding decision tree analysis and Analytic Hierarchy Process (AHP), visual decomposition the decision problem into hierarchy of easily comprehensible sub-problems and solving them without any efforts.
 Health Informatics
Health Informatics solution supplies the ConceptDraw DIAGRAM with tools and functionalities in a field of healthcare design and healthcare informatics. Including collection of professionally designed samples and a lot of high-quality health informatics vector design objects, it is the best for all medical workers and healthcare-related specialties when designing diagrams, schematics, flow charts, workflow charts, block diagrams, infographics, illustrations, and presentations slides in a field of Health Informatics, representing the newest medical information technologies, architectures of healthcare systems, principles of work of the specialized software, structures of health records systems, medical researches processes.
- Professional People Clipart Png
- Examples Of Solid Objects Clipart
- Design And Technology Clipart
- Project Materials Clipart
- People Eating At A Restaurant Clipart
- People In A Restaurant Clipart
- Presentation Skills Clipart
- Management Plan Clipart
- Design elements - Arrows | Illustration | Arrows - Vector clipart library ...
- Arrows - Vector clipart library | Circular Arrows Diagrams | Arrows ...