Flow chart Example. Warehouse Flowchart


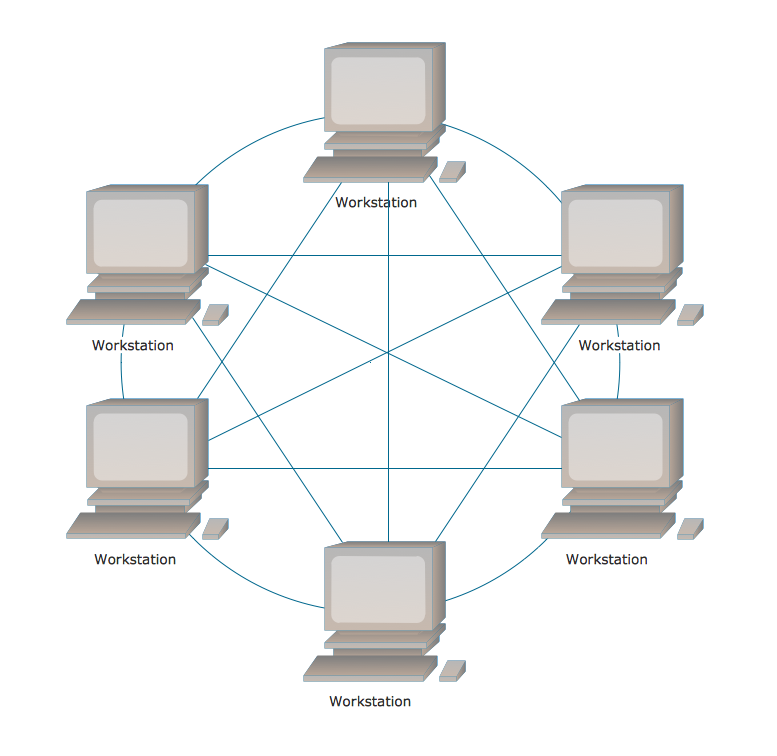
Fully Connected Network Topology Diagram
Example of DFD for Online Store (Data Flow Diagram)


Electrical Symbols, Electrical Diagram Symbols

Bar Diagrams for Problem Solving. Create manufacturing and economics bar charts with Bar Graphs Solution

Bar Diagrams for Problem Solving. Create economics and financial bar charts with Bar Graphs Solution

Bar Diagrams for Problem Solving. Create business management bar charts with Bar Graphs Solution

 Area Charts
Area Charts are used to display the cumulative totals over time using numbers or percentages; or to show trends over time among related attributes. The Area Chart is effective when comparing two or more quantities. Each series of data is typically represented with a different color, the use of color transparency in an object’s transparency shows overlapped areas and smaller areas hidden behind larger areas.
Bar Diagram Math

Diagram Software - The Best Choice for Diagramming

- Agricultural Pictorial Chart Images
- Chart Related To Agriculture
- Draw On Chart Related To Agriculture
- Area Charts | Bar Graph Of Agriculture In India
- Agriculture Related Pie Chart
- Pictorial Chart Related To Agriculture
- Bar Chart Of Agriculture Production In India
- Draw The Chart Of Agriculture
- Area Charts | Pie Charts Of Agriculture In India